
The Complete Valuation Playbook for Claims Management Businesses
A data-driven guide to how Claims Management businesses are valued and what drives high multiples.

If you run a Claims Management business and you are thinking about selling in the next 1-12 months, you are entering the window where preparation can change the result - not by a little, but by meaningfully.
This playbook is built to do three things: (1) show what businesses in and around this sector actually sell for (based on the data you provided), (2) explain what drives higher vs lower multiples in plain English, and (3) give you a practical self-assessment plus a 6-12 month action plan to improve valuation before you go to market.
A quick note: the datasets in are anchored in mobility/telematics-style platforms (hardware + software, compliance-heavy workflows, public-sector procurement, recurring SaaS economics). Many of the valuation mechanics transfer directly to Claims Management because the buyer questions are similar (mission-critical workflow, regulatory exposure, data defensibility, and recurring revenue quality). Where I reference multiples, I tie them to the provided groupings and explain how to translate them for Claims Management.
1. What Makes Claims Management Unique
Claims Management is not valued like a generic "software company" or a generic "services firm." Buyers pay for two things at once:
- Control of a workflow that must happen (claims have to be filed, validated, processed, and paid - on a deadline, under rules).
- Risk transfer and compliance confidence (buyers are underwriting whether your process reduces leakage, fraud, regulatory issues, and reputational blowups).
Main types of Claims Management businesses
Most Claims Management companies sit somewhere in a mix of these models:
- Third-Party Administrator (TPA) / managed claims operations: you run claims handling as a service, often per-claim or per-member.
- Claims software platforms (workflow + analytics): you sell claims intake, triage, adjudication support, and reporting as software, sometimes with implementation services.
- Specialty claims niches: workers' comp, auto, property & casualty, healthcare, subrogation, catastrophe response, or specific geographies with unique rules.
- Hybrid models: software plus service delivery, where software increases productivity and creates switching costs.
Unique valuation considerations buyers will always test
- Revenue quality: recurring vs transactional, contract length, auto-renewal terms, price increases, and churn.
- Operational durability: can the business run without the founder? Are outcomes consistent across adjusters/teams?
- Regulatory and data exposure: handling sensitive information means buyers will scrutinize compliance, security, audits, and incident history.
- Claims outcomes: error rates, cycle times, denial/approval patterns, customer satisfaction - and whether you can prove them.
Key risk factors that are specific to Claims Management
- Customer concentration (a few carriers/employers can be half your revenue).
- Dependence on a single channel (one broker, one referral partner, one government contract vehicle).
- Process risk (if your service quality slips, it is visible fast and can become litigation/regulatory risk).
- Technology debt (if you are selling "software" but it requires heroic services work to keep running, buyers price it as services).
2. What Buyers Look For in a Claims Management Business
Most founders think valuation is primarily "revenue x multiple." Buyers think more like: "How predictable is this revenue, how defensible is it, and how much risk am I inheriting?"
The obvious factors (still matter)
- Scale: bigger revenue base generally means more buyer options.
- Growth: consistent growth is a credibility signal.
- Profitability: EBITDA (operating profit) matters especially for services-heavy and mature businesses.
- Customer retention: the simplest proof that your business is mission-critical.
The claims-specific nuances that drive buyer confidence
- Stickiness is everything: switching claims platforms or administrators is painful - buyers will pay more if you can prove low churn and long renewals.
- Compliance posture: documented controls, security practices, and clean audit history reduce buyer fear.
- Evidence of outcome impact: if you can show you reduce leakage, accelerate cycle time, or improve return-to-work outcomes, your revenue becomes easier to defend.
- Integration footprint: embedded integrations into policy admin systems, billing, payment rails, or document management systems create switching costs.
How private equity buyers think (in plain terms)
Private equity is usually asking:
- "What multiple am I paying today, and can I sell it for the same or higher multiple later?"
- "Who buys this from me in 3-7 years?" Usually:
- a larger PE fund,
- a strategic buyer (carrier, claims software suite, HR/payroll/workforce platform, healthcare admin platform),
- or a consolidation platform in claims/TPA services.
- "What levers can I pull quickly?"
- Raise prices or tighten contract terms,
- Standardize operations and improve margins,
- Cross-sell adjacent modules (fraud analytics, payments, provider networks),
- Acquire smaller tuck-ins (if your platform is a consolidator).
If the buyer cannot see a clean "owner-to-operator" transition and an obvious 3-7 year exit path, they discount the valuation - even if you are growing.
3. Deep Dive: The Most Important Valuation Nuance in Claims Management
The question: Are you a software-like business, a services-like business, or a credible hybrid?
This is the valuation question that quietly decides whether you land in the top half or bottom half of your range.
In Claims Management, "software" and "services" often blur. Buyers do not mind hybrids - but they will not pay software multiples for a business that behaves like services.
In the data you provided, businesses with clearer recurring software economics and strong margins show higher valuation outcomes. For example, transactions and comps that highlight high gross margins and recurring subscription economics are associated with higher EV/EBITDA multiples (the "high recurring software margins" driver observed across MiX Telematics, Logentia, and e2open). Conversely, mixed models without clear profitability or recurring proof tend to anchor closer to mid-range revenue multiples. (Premium valuation drivers section + example logic.)
Why buyers care
- Services are harder to scale: you need more people to deliver more claims.
- Software scales better: once built, it can support more volume without linear headcount growth.
- Hybrids can be great if software actually drives productivity and stickiness - but you must prove it.
How to move from the "lower-value" profile to the "higher-value" profile in 6-12 months
You do not need to "become a pure SaaS company." You need to make your economics and customer contracts behave more like one:
- Move work that is repeatable into product workflows (templates, rules engines, triage automation).
- Package services as implementation + ongoing support, not as the core "thing being sold."
- Report KPIs that show operational leverage (claims per adjuster, cycle time reduction, rework rate).
A simple lens:
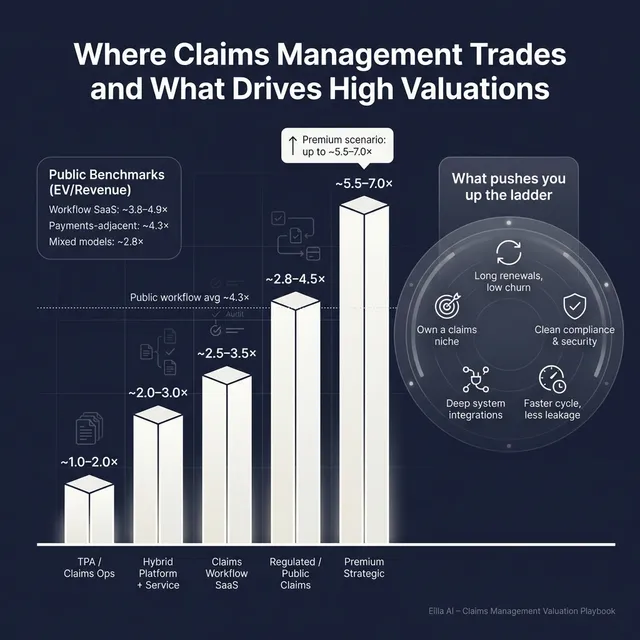
4. What Claims Management Businesses Sell For - and What Public Markets Show
Your sources provide private and public multiple ranges from adjacent workflow-heavy, compliance-heavy tech and service models. While not labeled "claims," the valuation patterns map well because the buyer logic is similar: regulated workflow, sticky contracts, and recurring revenue quality.
The key takeaway from the data: most comparable "workflow + compliance + recurring" businesses cluster in a mid single-digit revenue multiple band, with premiums only when defensibility and margins are clearly proven.
4.1 Private Market Deals (Similar Acquisitions)
Across the precedent transactions group averages, the private market shows:
- Overall average EV/Revenue around 1.9x and EV/EBITDA around 10.0x (group averages).
- Subgroups vary:
- "Transportation & Logistics Software (TMS/WMS, SaaS)" averages ~2.9x EV/Revenue and ~10.9x EV/EBITDA.
- "Fleet Telematics & Video Safety (SaaS + Hardware)" averages ~2.4x EV/Revenue and ~7.4x EV/EBITDA.
- More services-heavy sectors show lower revenue multiples (often around ~1.1x EV/Revenue in the asset-intensive services grouping).
For Claims Management, the translation is straightforward:
- If your business is services-heavy TPA-like, buyers often anchor closer to EBITDA multiples and lower revenue multiples.
- If your business is software-led workflow + analytics, revenue multiples become more relevant and can move higher if recurring revenue is clear.
A simple way to use the private ranges (illustrative):
These are not "rules." They are a reality check: the more your revenue looks like recurring, high-margin workflow software, the more your multiple behaves like the software groupings in the data.
4.2 Public Companies
Public markets provide an upper reference band - not a private "price tag." In your data, public group averages are:
- "Fleet Telematics & Video Safety SaaS Platforms" average ~3.8x EV/Revenue and ~15.6x EV/EBITDA.
- "Fleet Payment, Fuel Card & Toll/Violation Management" average ~4.3x EV/Revenue and ~9.8x EV/EBITDA.
- "Digital Maps, Navigation & Geospatial Software/Services" average ~4.9x EV/Revenue and ~21.7x EV/EBITDA.
- Some groups show extreme dispersion due to outliers (for example the "Logistics Platforms" group has a very high average EV/Revenue but a much lower median, indicating outliers).
These public multiples (as of mid-to-end 2025, per your instruction to frame them that way) are useful because they show how the market rewards:
- recurring revenue,
- scale,
- and mission-critical workflows.
A clean founder-friendly summary:
How to use these as a Claims Management founder:
- Treat public multiples as a reference band.
- Adjust downward for smaller scale, higher concentration, weaker contract terms, or more services-heavy delivery.
- Adjust upward only when you can prove scarcity: long-term contracts, embedded integrations, strong margins, and measurable outcomes.
5. What Drives High Valuations (Premium Valuation Drivers)
The premium drivers in your data are extremely transferable to Claims Management because claims is also a regulated, high-stakes workflow with high switching costs when embedded well.
Below are the premium drivers, grouped into themes, with plain-English "why buyers pay more" and what it looks like in Claims.
5.1 Mission-critical, regulated workflows with switching costs
Your sources show premiums when solutions are embedded in regulated, safety-critical workflows with long replacement cycles and procurement moats (observed in Transcore and Global Traffic Technologies). Buyers pay up when "this cannot break."
In Claims Management, this is:
- Being the platform/process used for regulated claims handling.
- Having proven auditability, traceability, and compliance controls.
- Long-term contracts with renewal history (especially public sector or heavily regulated segments).
Practical examples:
- Multi-year framework agreements with renewal proof.
- Documented compliance processes, security posture, and incident response playbooks.
- Clear "what happens if we turn you off?" pain for the customer.
5.2 High recurring software margins and visible profitability
Premium outcomes in the data correlate with recurring software economics and strong margins (MiX Telematics, Logentia, e2open). Buyers are not allergic to services - they are allergic to low-visibility margins.
In Claims Management, this is:
- A high percentage of recurring platform fees.
- Demonstrable gross margin strength (often a proxy for how "software-like" you are).
- EBITDA margins that improve with scale.
Practical examples:
- Separating implementation from subscription in reporting.
- Showing renewal rates and net retention (customers staying and paying more).
- Demonstrating operating leverage: claims volume grows faster than headcount.
5.3 Vertical specialization that makes you hard to replace
Your data shows premiums when vendors "own a vertical" with domain-specific features and embedded tooling (MiX; c-trace as vertical leader in waste logistics tech). The concept is: a generic tool is easy to swap, a niche specialist is not.
In Claims Management, vertical specialization can be:
- A specific claim type (workers' comp, auto, property, healthcare).
- A niche compliance environment (certain states/countries, public sector).
- A proprietary workflow that materially improves outcomes.
Practical examples:
- Deep templates and rules engines for your niche.
- Benchmark data that customers cannot get elsewhere.
- Specialist reporting and regulatory outputs that reduce customer workload.
5.4 Hardware or deep integrations that create an installed base
In the data, embedded hardware + software and device-installed bases can reduce churn and raise revenue per customer (Coretex; c-trace). In Claims, your "hardware" equivalent is integration footprint and data connectivity.
This looks like:
- Integrations into policy admin systems, payroll/HR systems, document stores, payment systems, and customer portals.
- Once you are stitched into the workflow, switching is expensive.
Practical examples:
- Clear API documentation and stable integration patterns.
- A mature implementation playbook that reduces go-live risk.
- Customer references where switching is "not worth the pain."
5.5 Strategic buyer synergy and consolidation logic
Your sources highlight consolidation strategies where strategics pay up for platforms that unlock cross-sell and data harmonization (MiX Telematics and Fleet Complete consolidation logic). Buyers pay more when your business accelerates their strategy.
In Claims, synergy narratives include:
- A larger platform wanting your niche capability.
- A services player wanting your software to improve margins.
- A suite provider wanting your distribution or embedded customer base.
Practical examples:
- Showing expansion potential across adjacent modules (fraud detection, payments, provider networks).
- Building "plug-in" modules that a strategic can sell across their base.
- Demonstrating that your customer base overlaps with acquirer targets.
Also include the basics (always matter, even if not in sources):
- Clean financials and consistent reporting
- Diversified customer base
- Strong second-layer leadership
- Predictable contract terms and renewal mechanics
6. Discount Drivers (What Lowers Multiples)
Discounts happen when buyers see avoidable risk, unclear economics, or fragile revenue. The data also hints at this: when margins, differentiation, or recurring proof are not present, the logic stays anchored in mid-range multiples rather than premium outliers.
The most common valuation discounts in Claims Management
- Too much services concentration: if revenue depends on adding people, buyers worry margin expansion is limited.
- Customer concentration: one or two customers can dictate terms and create cliff risk.
- Short-term or cancellable contracts: buyers price your revenue as "less real."
- Outcome risk: if error rates, litigation exposure, or complaint rates are unclear, buyers assume the worst.
- Weak security/compliance posture: even one unresolved issue can slow or derail a deal.
- Founder dependency: if relationships and operations run through you, buyers discount to cover transition risk.
- Messy revenue reporting: if you cannot clearly separate recurring vs one-time, buyers discount the entire base.
A helpful way to think about discounts:
- Buyers rarely punish you for having problems.
- They punish you for surprises, uncertainty, and lack of proof.
7. Valuation Example: A Claims Management Company
This is a worked example to show the logic - not a promise, not a fairness opinion, and not investment advice.
Fictional company: "NorthBridge Claims"
- Business type: hybrid claims platform (software + managed services)
- Revenue: USD 10.0m (fictional)
- Customers: mid-market insurers and self-insured employers
- Revenue mix: subscription platform fee + per-claim processing + implementation
- Differentiation: deep workflows in a specific claim type, integrations into customer systems
- Unknowns (common in founder businesses): margins and exact retention metrics not perfectly packaged yet
Step 1: Pick a base multiple range using the provided logic
Your sources include a "fictional USD 10m revenue" logic example for a small-scale workflow platform that is software plus embedded hardware. Translating that approach to Claims:
- Public comps in workflow-heavy, compliance-adjacent categories cluster in the ~2.0x–4.3x EV/Revenue band for the relevant middle-of-the-pack ranges.
- Private comps for similar workflow SaaS + mixed models often cluster around ~2.0x–3.5x EV/Revenue.
- The example logic ultimately narrows to a defensible band of ~2.8x–4.5x EV/Revenue for a mixed model at this scale when premium drivers are not fully proven.
For NorthBridge Claims, we use that same disciplined approach:
- Base case multiple range: ~2.8x–4.5x revenue
- Why: It reflects mid-range outcomes for small, mixed workflow businesses and avoids "premium outlier" territory unless premium drivers are proven.
Step 2: Apply base, premium, and discount scenarios to USD 10m revenue
How the scenarios happen in real life:
- Discounted case (2.0–2.8x): high services dependence, short contracts, weak retention proof, customer concentration, or compliance gaps.
- Core case (2.8–4.5x): solid business with reasonable stickiness, but not yet packaged with clear recurring economics and premium defensibility.
- Premium case (up to ~5.5–7.0x): requires strong evidence of premium drivers from the sources translated to claims:
- high recurring revenue mix,
- strong gross margin and EBITDA margin,
- low churn with long renewals,
- mission-critical regulated deployments,
- deep integration footprint,
- and clear category leadership in a niche.
Step 3: What this means for you
Two Claims Management businesses with the same USD 10m revenue can be worth wildly different amounts because buyers are paying for predictability + defensibility, not revenue in isolation.
If you are selling in 1-12 months, your job is to:
- reduce uncertainty,
- prove what is already true about your stickiness and outcomes,
- and package the business so buyers can underwrite it confidently.
8. Where Your Business Might Fit (Self-Assessment Framework)
This is a simple scoring tool to help you estimate whether you are closer to the lower end, the fair middle, or the premium end of the range.
How to use it:
- Score each factor 0 / 1 / 2
- 0 = not true / weak
- 1 = partially true / improving
- 2 = clearly true / proven with data
- Be honest - this is for you, not for marketing.
A simple interpretation:
- High band (mostly 2s): you look more like the premium profile - more buyers will compete.
- Middle band (mix of 1s and 2s): fair market outcomes, but you can move up with packaging and proof.
- Low band (many 0s): you can still sell, but expect tougher terms and lower multiples unless you fix the biggest risks.
9. Common Mistakes That Could Reduce Valuation
Rushing the sale
If you launch a process before your numbers and story are ready, buyers fill the gaps with caution. In Claims Management, caution quickly becomes discounted valuation because buyers fear compliance and operational risk.
Hiding problems
Issues will surface in diligence. If buyers find them first, trust breaks and value leaks out through:
- price reductions,
- holdbacks/escrows,
- earnouts,
- or the deal dying.
Weak financial records
Many claims businesses track revenue well but do not track profitability and unit drivers cleanly. Fixable issues in 6-12 months include:
- separating recurring vs one-time revenue,
- clean gross margin reporting (especially if you mix services and software),
- clear customer-level profitability,
- and consistent KPI reporting (volume, cycle time, rework).
Not running a structured, competitive sale process with an advisor
A structured competitive process changes buyer behavior. You are not "asking one buyer what they think." You are forcing multiple buyers to compete on price and terms.
Research often cited in M&A practitioner circles suggests structured, competitive processes can lift purchase prices meaningfully - sometimes around 25% relative to one-off negotiations (directionally, not a guarantee). Treat it as a reminder: competition matters.
Revealing what price you're after instead of letting the market bid
If you say "we want USD 10m," do not be surprised if you get offers at USD 10.1m and USD 10.2m. You killed price discovery.
Let buyers tell you what it is worth to them. Your job is to increase the number of credible buyers and make them confident.
Two claims-specific mistakes founders make
- Not proving compliance and security readiness early: if diligence uncovers gaps late, timelines slip and leverage flips to the buyer.
- Not quantifying outcome impact: claims is outcome-driven. If you cannot prove you reduce leakage, speed cycles, or improve return-to-work outcomes, you look like a replaceable vendor.
10. What Claims Management Founders Can Do in 6-12 Months to Increase Valuation
This is the "doable" plan - no fantasy pivots required.
10.1 Improve revenue quality (fastest multiple impact)
- Increase recurring revenue share: convert transactional work into minimum monthly platform fees where possible.
- Tighten contracts: longer terms, clearer renewals, and sensible price increase clauses.
- Reduce customer concentration: even one new mid-sized customer can change the risk profile.
10.2 Make profitability and unit drivers easy to underwrite
- Separate reporting: subscription, per-claim fees, implementation, and other services.
- Track gross margin by line: buyers want to see what scales.
- Document operational leverage: claims handled per adjuster, cycle time trends, rework rates.
10.3 De-risk compliance, security, and operations
- Package your compliance story: policies, controls, training logs, incident history, and remediation evidence.
- Standardize SOPs: claims handling playbooks, QA processes, escalation paths.
- Reduce founder dependency: put customer relationships and delivery leadership in a second layer.
10.4 Strengthen differentiation and stickiness
- Deepen integrations: the "installed base" effect in claims is integration and workflow embedment.
- Build proof of outcome impact: simple dashboards that show measurable improvements customers care about.
- Create 3-5 high-quality case studies: not marketing fluff - credible before/after metrics and customer quotes.
10.5 Build a buyer-ready narrative
- Define your category: what niche you own and why switching away is painful.
- Explain who the buyer is and why they care:
- strategic cross-sell,
- margin improvement,
- regulated workflow defensibility.
This is where founders often win: you are not just selling a company - you are selling a de-risked future cash flow stream that a buyer can confidently own.
11. How an AI-Native M&A Advisor Helps
Most valuation uplift in a sale comes from two things: more buyer competition and less buyer uncertainty. AI-native advisory is designed to improve both.
First, an AI-native approach can drive higher valuations through broader buyer reach. Instead of relying on a short list, AI can expand the buyer universe to hundreds of qualified acquirers based on deal history, likely synergies, and capacity to buy. More relevant buyers means more competition, stronger offers, and more fallback options if one buyer drops out.
Second, AI can help you reach initial offers in under 6 weeks by speeding up buyer matching, outreach, marketing materials, and the early diligence workflow. In practice, the timeline advantage comes from removing manual bottlenecks that slow traditional processes.
Third, you still need real advisory judgment. The best model is expert human M&A advisors, enhanced by AI: experienced deal leads shaping positioning, building credibility with buyers, and preparing materials that communicate your business in the buyer’s language - without the overhead of traditional "bulge bracket" costs.
If you’d like to understand how an AI-native process can support your exit, book a demo with one of our expert M&A advisors.
Are you considering an exit?
Meet one of our M&A advisors and find out how our AI-native process can work for you.


