
The Complete Valuation Playbook for Fleet Management Businesses
A data-driven guide to how fleet management businesses are valued and what drives high multiples.

If you are running a fleet management business and you are considering a sale in the next 1-12 months, valuation is not a mystery - but it is also not a formula.
In this sector, two companies with the same revenue can sell for very different prices because buyers are really pricing: (1) how durable your revenue is, (2) how much of it is true software-like recurring revenue, and (3) how “embedded” you are in compliance, safety, and day-to-day operations.
This playbook is data-based and founder-friendly. It will show what fleet management businesses actually sell for, decode what drives higher vs lower multiples, and give you a practical self-assessment plus a 6-12 month action plan to increase valuation.
1. What Makes Fleet Management Unique
Fleet management is a broad label for a few different business models that look similar on the surface but price very differently.
The main “types” inside fleet management
- Fleet telematics and video safety platforms (software, often with devices installed in vehicles)
- Asset tracking IoT and mixed solutions (more hardware-heavy, sometimes sold via channel partners)
- Managed fleet services and logistics platforms (more services-heavy, sometimes closer to a transportation services business)
- Adjacent workflow categories buyers often compare you to: fleet payments (fuel cards, tolls, violations), driver monitoring/safety tech, and transportation management software (TMS)
Why valuation is different here than “generic software”
Fleet management sits in a rare intersection:
- It touches safety and compliance (which can create real switching costs).
- It touches the physical world (devices in vehicles, installations, replacements).
- It often sells into operations teams (who care about uptime, reliability, and support, not just features).
That means buyers don’t just pay for “growth.” They pay for proof that your product is hard to replace and that your revenue doesn’t disappear when budgets tighten.
Key risks buyers will always check in this sector
- Device and installation complexity: Are deployments smooth, or do installs and support eat margins?
- Churn hidden by hardware: Some fleets keep the device but downgrade, stop using modules, or reduce seats.
- Compliance exposure: If you touch regulated workflows (ELD/HOS, safety, municipal procurement), buyers want clean evidence you can keep up.
- Data reliability: In fleet, bad data breaks trust fast. Buyers check outages, accuracy, and sensor/device failure rates.
- Customer concentration: A few large fleets can make growth look great - until one procurement cycle goes against you.
2. What Buyers Look For in a Fleet Management Business
Buyers value fleet management businesses through a simple lens: “How predictable is the cash flow, and how defensible is the customer relationship?”
The obvious fundamentals still matter
- Revenue scale (bigger tends to reduce perceived risk)
- Growth rate (especially if it is efficient and repeatable)
- Profitability (or a clear path to it)
- Gross margin (a proxy for how “software-like” you are)
The fleet-specific things that matter even more
- Recurring revenue quality: Is revenue truly subscription-like, or does it depend on one-time installs, hardware refresh cycles, or project work?
- Stickiness: Are you part of a daily workflow (dispatch, safety coaching, compliance reporting), or are you a “nice-to-have” dashboard?
- Embedded hardware plus software: Devices in vehicles can reduce churn - but only if contracts and economics are structured well.
- Proof of ROI: Buyers love fleets that can say: “We reduce accidents by X, fuel by Y, idle time by Z.” It makes renewals and expansion believable.
- Integration reality: If you integrate into payroll, maintenance, routing, fuel, insurance, OEM data, etc., you become harder to rip out.
How private equity (PE) thinks about your business
PE buyers usually ask:
- “If we buy at X multiple, can we sell in 3-7 years at the same or higher multiple?”
- “Who will buy it from us later - a bigger strategic buyer, a larger PE fund, or public markets?”
- “What levers can we pull quickly?”
Common levers PE expects in fleet management:
- Price increases that stick because you are embedded in compliance/safety workflows
- Expanding wallet share through module upsells (video, maintenance, EV analytics, driver coaching, fuel)
- Improving gross margin by tightening device costs, install processes, and support efficiency
- Add-on acquisitions (buying smaller competitors or niche vertical solutions) if integration is feasible
The key: PE is not just buying your product - they are buying your ability to become a more “software-like,” recurring, scalable platform.
3. Deep Dive: The #1 Valuation Nuance in Fleet - “Software-Like Recurring Revenue” vs “Hardware + Services Drag”
In fleet management, valuation often comes down to one question:
Are you primarily a recurring software business that happens to use devices - or a hardware/services business that happens to include software?
Buyers pay very different multiples depending on the answer, even if the product looks similar in demos.
How it shows up in deal data
Across comparable transactions, fleet telematics and mixed SaaS+hardware deals tend to cluster around roughly 2.0x-3.0x revenue on average, with higher outcomes when the business demonstrates strong recurring economics and defensibility. In the data provided, the fleet telematics (SaaS + hardware) precedent group averages about 2.4x EV/Revenue and about 7-8x EV/EBITDA where EBITDA is available.
Meanwhile, public markets show a wider spread: some fleet telematics software platforms trade around 3-4x revenue on average/median, while more hardware-mixed categories trend lower on revenue multiples. The “software-like” ones typically have better gross margins and clearer recurring revenue narratives.
Why buyers care
Because in a sale, buyers are really buying your future profit stream. Hardware and services can be valuable, but they can also:
- compress gross margin
- create operational complexity
- make growth less predictable
- increase customer support burden
Recurring software revenue does the opposite: it creates predictability and makes the business easier to underwrite.
How to move from “lower-value” to “higher-value” over time
You usually do not need a radical pivot. You need tighter packaging and evidence:
- Shift contracts toward subscription + minimum terms (instead of “month to month” device economics)
- Separate one-time install revenue from recurring platform fees so recurring revenue is obvious
- Reduce custom work and “special integrations” that become permanent support obligations
- Prove expansion revenue (customers paying more over time) via modules, seats, vehicles, or add-ons
Here’s a simple profile comparison:
4. What Fleet Management Businesses Sell For - and What Public Markets Show
Valuation multiples are not a scoreboard. They are a way to translate risk and quality into a price.
The cleanest way to use market data is to treat it as a reference band - then adjust based on your company’s growth, margins, recurring revenue, and risk profile.
4.1 Private Market Deals (Similar Acquisitions)
From the private precedent transaction data provided, fleet-related deals show a meaningful spread based on business mix:
- Fleet telematics (SaaS + hardware) transactions cluster around ~2.0x-2.6x revenue in the examples, with EBITDA multiples in the high single digits to low double digits when profitability is present.
- Transportation and logistics software (TMS/WMS SaaS) groups land closer to ~2.0x-3.9x revenue, reflecting more “pure software” economics.
- Services-heavy, asset-intensive transportation/logistics businesses (non-software) are typically lower on revenue multiples, often around ~0.6x-1.1x revenue (median vs average), because they look more like operational services than recurring software.
A practical founder table:
These are illustrative ranges. Your actual multiple depends on how “software-like” and defensible your revenue looks to the specific buyer.
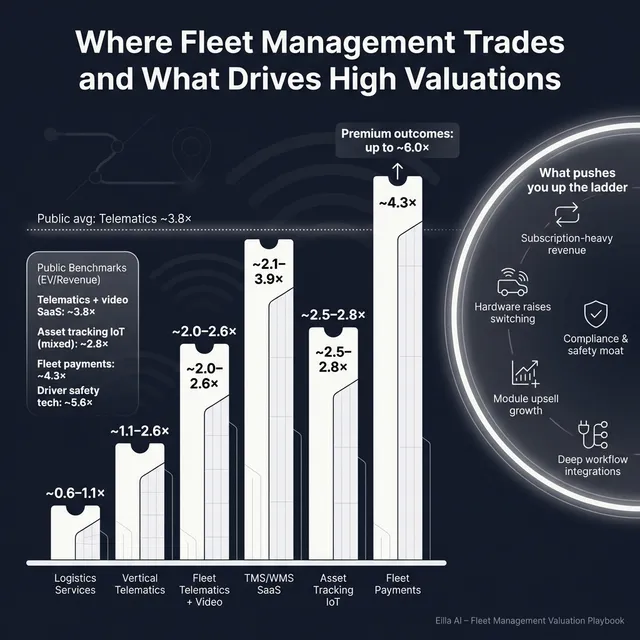
4.2 Public Companies
Public markets provide a useful reality check, especially for what scaled buyers think is “normal” pricing in the sector.
From the public peer group averages provided (as of mid/late 2025 in the dataset):
- Fleet telematics & video safety SaaS platforms average around 3.8x revenue and ~15.6x EBITDA (median revenue multiple around 3.7x).
- Asset tracking IoT hardware & mixed solutions average around 2.8x revenue (median ~2.5x), with EBITDA multiples that can look high because profitability varies widely.
- Fleet payment / toll / violation management businesses average around 4.3x revenue and ~9.8x EBITDA - they often have payment-like stickiness and scale.
- Driver monitoring/safety tech trades higher on revenue where it is perceived as differentiated, but EBITDA comps are inconsistent due to losses.
A simple summary table:
How to use this as a private founder:
- Treat public multiples as a reference band, not a price tag.
- Adjust down for smaller scale, weaker margins, higher churn, or customer concentration.
- Adjust up only if you have clear proof of scarcity: category leadership, compliance moats, or unusually strong recurring economics.
5. What Drives High Valuations (Premium Valuation Drivers)
Here is what the deal patterns suggest - and what experienced buyers consistently pay extra for in fleet management. These are the themes that move you toward the top end of the range.
5.1 Mission-critical, regulated, and procurement-driven revenue
Buyers pay more when your solution is tied to safety, compliance, or regulated workflows, especially in public-sector or municipal environments.
Why:
- Long procurement cycles create “inertia” - once you are in, you tend to stay in.
- Switching is painful because it risks compliance failure or safety regression.
What it looks like in practice:
- Multi-year contracts with municipalities, emergency services, utilities, waste, public transit
- Framework agreements or renewals that show you are “standard”
- Proven compliance posture and auditability
5.2 High margins and clear recurring software economics
In the provided deal commentary, higher EBITDA outcomes correlate with strong gross margins and meaningful EBITDA margins when the business is truly subscription-driven.
Why:
- Buyers can underwrite the future cash flow with confidence.
- It implies pricing power and lower support burden per dollar of revenue.
Founder-friendly proof points:
- Percentage of revenue that is recurring subscriptions
- Renewal rates and net retention (customers staying and paying more over time)
- Gross margin that holds up as you grow
5.3 Category leadership in a specific vertical (with depth, not breadth)
Vertical leaders can command premium outcomes even without being huge, because they become the default choice in a niche.
Why:
- Niche depth beats generic platforms in operations-heavy industries.
- Buyers see clearer differentiation and better pricing defensibility.
Examples of “depth” in fleet:
- Waste fleet logistics workflows, RFID tagging, contamination tracking
- Utilities and field service compliance + safety programs
- Cold chain monitoring + route exceptions
- Construction fleet safety and equipment utilization
5.4 Hardware integration that reduces churn (when structured correctly)
Hardware can be a moat if it is embedded and the economics are subscription-led.
Why:
- Installed devices increase switching costs.
- Replacement cycles and device “attach” can increase lifetime value.
What buyers want to see:
- Device attach rates by module (video, sensors, diagnostics)
- Replacement/upgrade cycles
- Contract structures that avoid “easy churn after install”
5.5 Demonstrable strategic synergy for consolidators
There is active consolidation in telematics and AIoT platforms. Strategics pay up when they can clearly cross-sell or integrate data across assets.
Why:
- Buyers can grow revenue faster post-acquisition via cross-sell.
- They can reduce costs by consolidating platforms and back office.
Proof points founders can create:
- Clean APIs and integrations that make your product “pluggable”
- Case studies of customers adopting multiple modules
- Geographic or vertical footprints that fill a gap for larger players
5.6 The basics that still matter in every premium deal
Even if your product is great, premiums get discounted when fundamentals are messy:
- Clean financials and clear revenue recognition (simple, credible numbers)
- Diversified customer base
- A leadership bench beyond the founder
- Evidence you can keep growing without heroic effort
6. Discount Drivers (What Lowers Multiples)
Discounts usually come from one of two things: buyers fear the revenue is not durable, or they fear the business is harder to operate than it looks.
Revenue durability red flags
- High customer concentration (one or two fleets are “the business”)
- Short-term contracts with easy cancellation
- Weak proof of renewals and expansion
- Growth driven mainly by one channel partner or one salesperson
“Looks like software, runs like services” issues
- Heavy install labor, custom deployments, or endless bespoke integrations
- Support costs that scale linearly with revenue
- Low gross margins due to device subsidies, connectivity costs, or inefficient operations
Product and data risk
- Reliability issues: outages, inaccurate data, sensor/device failure
- Product sprawl: too many half-finished modules that create complexity without upsell
Compliance and procurement risk
If you claim you are “mission-critical,” buyers will test it:
- missing compliance certifications
- unclear audit trails
- weak security posture
- no evidence of successful re-procurements or renewals
Process risk
- Founder dependency (sales, product, or key customer relationships live in your head)
- Poor documentation and no repeatable onboarding/deployment playbook
The good news: many of these are fixable in 6-12 months - and fixing them often has a bigger valuation payoff than adding a little extra growth.
7. Valuation Example: A Fleet Management Company
This is a worked example to show the logic, not a prediction. The company and numbers are fictional.
Step 1: The simple logic (how buyers triangulate a multiple)
For a fleet management business that is software plus embedded devices, a realistic approach is:
- Start with the closest public peer bands for telematics software platforms and mixed IoT solutions.
- Cross-check against private precedent deals in fleet telematics (SaaS + hardware) and adjacent logistics software.
- Pick a “core range” that reflects your scale and business mix.
- Adjust up or down based on premium drivers (recurring revenue, margins, stickiness, leadership) and discount drivers (services drag, churn, concentration, messy numbers).
Based on the data provided, a credible core band for a smaller mixed telematics vendor is often around 2.0x-4.3x revenue, with a more “defensible” narrowed band around 2.8x-4.5x when you assume some software value but not extreme premium characteristics.
Step 2: Apply it to a fictional business
Let’s create “NorthBridge Fleet”, a fictional fleet management platform.
Assumptions (fictional):
- USD 10.0m annual revenue
- Mix: telematics platform + devices, sells mid-market fleets
- Solid product, but not clearly an AI/video category leader
- Some recurring subscription revenue, but not yet “best-in-class”
Now the scenarios:
What would justify each?
- Discounted case: high services mix, weak contract terms, customer concentration, low gross margin, unclear retention.
- Core range: reasonable recurring mix, acceptable margins, stable customer base, believable product ROI.
- Premium case: strong recurring subscription mix, high gross margin, multi-year contracts, proven stickiness in compliance/safety workflows, and clear vertical leadership or strategic scarcity.
Step 3: What this means for you
Two USD 10m revenue businesses can be worth USD 20m or USD 60m because buyers are not paying for revenue - they are paying for the quality and durability of that revenue.
This is why the “valuation work” in the months before a sale is less about negotiating and more about making your business easier to underwrite.
Disclaimer: This is not investment advice or a formal valuation. It is an illustrative example to show how valuation logic works.
8. Where Your Business Might Fit (Self-Assessment Framework)
Use this as an honest internal tool. Score each factor 0-2:
- 0 = weak / not proven
- 1 = okay / partially proven
- 2 = strong / clearly proven with data
Self-assessment table
How to interpret your score
- High score across high-impact factors: you are closer to premium outcomes because the revenue is easier to underwrite.
- Mixed scores: you can likely sell, but you will see buyers push harder on price and structure (earnouts, holdbacks).
- Low scores in high-impact factors: you might still sell, but the bigger win is often delaying 6-12 months to fix the obvious risk flags.
9. Common Mistakes That Could Reduce Valuation
9.1 Rushing the sale
If you start a process before your numbers and story are ready, you create uncertainty. Uncertainty shows up as a lower offer, more earnout, or more “we’ll see after diligence.”
9.2 Hiding problems
Every real business has issues. Buyers can accept issues - they discount surprises. If you hide churn, a security incident, a major customer risk, or margin problems and it surfaces later, buyers often retrade the price or lose trust entirely.
9.3 Weak financial records
Fleet management businesses often have messy revenue categories: hardware, installs, subscriptions, connectivity, professional services. If you cannot clearly separate them, buyers assume the worst.
Low-hanging fruit in this sector:
- Clean separation of recurring vs one-time revenue
- Clear gross margin by line (software vs device vs services)
- Cohort-like views: retention by customer segment and contract vintage
9.4 No structured competitive process
A single-buyer negotiation is rarely a seller’s best outcome. Running a structured, competitive process with an experienced advisor typically leads to meaningfully higher purchase prices - research is often cited around ~25% uplift when competition and process discipline are present.
9.5 Revealing your target price too early
If you say “we want USD 10m,” do not be surprised if offers cluster at USD 10.1m and USD 10.2m. You killed price discovery. Let the market tell you what you are worth, then negotiate from a position of information.
9.6 Fleet-specific mistake: under-investing in proof of retention and ROI
In fleet, buyers want proof that customers stay because you deliver measurable outcomes. If you cannot show renewals, expansion, and ROI case studies, you leave money on the table even if the product is good.
10. What Fleet Management Founders Can Do in 6-12 Months to Increase Valuation
You do not need a miracle. You need proof, clarity, and reduced buyer fear.
10.1 Improve the “valuation fundamentals” buyers underwrite
- Increase the visible share of recurring revenue (repackage contracts so subscription value is clear)
- Push more customers onto annual or multi-year terms where reasonable
- Build a simple renewal workflow: 120/90/60-day pre-renewal process, documented and repeatable
- Reduce customer concentration where possible (even a few smaller logos can help the story)
10.2 Make your economics look more software-like
- Report gross margin separately for software vs hardware vs services
- Reduce device subsidies that distort margins (or explain them clearly as CAC, not ongoing cost)
- Standardize installs and onboarding to reduce labor and variability
- Track support burden: tickets per customer, time to resolution, cost per ticket
10.3 Build “stickiness evidence” that buyers can’t ignore
- Document and publish internal ROI case studies (accidents, fuel, idle time, compliance events)
- Prove module upsell: show how many customers adopt a second or third module
- Strengthen integrations that embed you into workflow (maintenance, payroll, routing, fuel, OEM data)
- Create churn analysis: why customers leave, what you changed, and proof it worked
10.4 Reduce diligence risk before the process starts
- Clean customer contracts (terms, pricing, cancellation, data rights)
- Security and reliability posture (basic controls, incident response plan, uptime reporting)
- Founder dependency plan: who runs sales, ops, product if you step back tomorrow?
10.5 Tell a clearer “why us” story for the right buyer types
- For strategic buyers: emphasize synergy (cross-sell modules, data integration, vertical footprint).
- For PE: emphasize repeatability (retention, pricing power, margin expansion path).
- For both: show that growth is not a one-time spike - it is a system.
11. How an AI-Native M&A Advisor Helps
Selling a fleet management business is not just about finding “a buyer.” It is about finding the right buyers, creating competition, and running a clean process where your strengths are proven and your risks are contained.
An AI-native M&A advisor like Eilla AI can help expand your buyer universe far beyond a manual list. AI can map hundreds of qualified acquirers based on deal history, synergy fit, financial capacity, and other signals. More relevant buyers means more competition, stronger offers, and a higher chance the deal closes because you have options if one buyer drops.
Speed also matters. With AI-driven buyer matching, faster outreach, and help generating strong marketing materials and diligence workflows, you can often reach initial conversations and offers in under 6 weeks - much faster than traditional manual-only processes.
Finally, you still want experienced humans driving the deal. The best outcome usually comes from expert M&A advisors who know how buyers think - with AI enhancing the work: sharper positioning, better materials, tighter process management, and stronger negotiation leverage. The goal is “Wall Street-grade” advisory quality without traditional bulge bracket costs.
If you would like to understand how an AI-native process can support your exit, book a demo with one of our expert M&A advisors.
Are you considering an exit?
Meet one of our M&A advisors and find out how our AI-native process can work for you.


