
The Complete Valuation Playbook for Healthcare Data and Analytics Businesses
A sector-specific valuation playbook for healthcare data and analytics businesses.

If you run a healthcare data and analytics business and you are considering a sale in the next 1-12 months, valuation is not just a math exercise - it is a narrative plus risk assessment plus buyer psychology, all grounded in comparable deals.
This playbook is built for your sector. It shows what healthcare data and analytics businesses actually sell for, what drives higher vs lower multiples, and how to self-assess your position - with a practical 6-12 month plan to improve outcomes before you go to market.
Healthcare is also in a very “buyer-specific” moment: strategic acquirers are still paying up for scarce datasets, workflow control, and assets that can move payer outcomes, while more generic “analytics services” and marketing-adjacent offerings are valued far more conservatively. That spread is the core opportunity - and the core risk.
1. What Makes Healthcare Data and Analytics Businesses Unique
Healthcare data and analytics companies are not valued like generic software firms because the “product” is often a mix of software, data rights, and regulated trust.
The main types of healthcare data and analytics businesses
Most private companies in this space fall into a few common shapes:
- Provider-facing analytics platforms: quality improvement, clinical decision support, cost accounting, capacity and staffing analytics, population health dashboards.
- Payer analytics and payment integrity: risk adjustment support, claims analytics, fraud/waste/abuse detection, care gap closure workflows, member outreach targeting.
- Life sciences RWE and commercialization analytics: real-world evidence (RWE) studies, patient journey analytics, clinical trial feasibility, HCP targeting, omnichannel measurement.
- Data infrastructure and enablement: healthcare data warehouses, interoperability layers, EMR integrations, de-identification pipelines, master patient index or identity resolution.
- Hybrid “data + services” shops: analytics plus implementation, managed services, clinical consulting, and bespoke reporting.
Unique valuation considerations in this sector
Compared to typical SaaS, buyers care disproportionately about:
- Data rights and defensibility: Do you own the data, have durable access, or are you just renting it from third parties?
- Regulatory posture: HIPAA, GDPR, local health data laws, consent models, de-identification approach, audit readiness.
- Proof of impact: Buyers pay more when you can demonstrate measurable outcomes (cost of care, quality scores, adherence, readmissions, risk capture).
- Workflow embed and switching costs: If you sit inside a clinical or payer workflow, switching is painful - and valuation improves.
- Sales cycle reality: Enterprise healthcare sales cycles are long and political. That affects growth predictability and customer concentration risk.
The key risks buyers will always check
In diligence, sophisticated buyers nearly always dig into:
- Data provenance and permissions (where it comes from, who owns it, how it can be used, what happens if a partner relationship ends).
- Patient privacy and security controls (policies, access logs, incident response, penetration testing, certifications).
- Regulatory and contracting compliance (BAAs, DPAs, subcontractor controls, data residency).
- Customer concentration (one payer or one health system can represent “hidden leverage” that cuts both ways).
- Repeatability of delivery (is value delivered by a scalable product, or by heroics and custom work).
2. What Buyers Look For in a Healthcare Data and Analytics Business
Buyers use a simple lens: “How predictable is this cash flow, how defensible is it, and how much can we grow it under our ownership?”
The obvious things still matter
Even in a specialized sector, the basics anchor everything:
- Revenue scale and growth rate
- Recurring revenue (subscription, multi-year contracts, per-member-per-month fees)
- Gross margin (how much is software/data vs services)
- Retention (do customers renew, expand, and reference you)
- Clean financials (buyers pay more when they trust your numbers)
The sector-specific “real questions”
In healthcare data and analytics, buyers quickly get more specific:
- Is your data advantage real? Unique coverage, refresh cadence, longitudinal depth, outcomes linkages, and evidence that competitors cannot replicate quickly.
- Do you influence outcomes that matter financially? Payers and value-based provider groups care about things that change the medical loss ratio, quality bonuses, and risk adjustment.
- Are you embedded in regulated workflows? Integration into clinical records, claims systems, or compliance-driven processes can raise switching costs.
- Is your offering “mission-critical” or “nice-to-have”? In this sector, “nice-to-have analytics” gets repriced downward fast in a tougher budgeting environment.
How private equity (PE) thinks about your business
PE buyers generally underwrite a 3-7 year path. Their mental model is:
- Entry multiple vs exit multiple: If they buy at a high multiple, they need a credible story to sell later at a similar or higher multiple.
- Who can we sell to later? Often a larger PE fund, a strategic buyer (payer, provider platform, life sciences software), or occasionally public markets.
- What levers can we pull?
- Move more revenue to recurring subscriptions
- Productize repeatable services into software modules
- Improve gross margin via automation and standardized pipelines
- Upsell additional use cases across the same customer base
- Tighten cost structure and build a deeper management team
If your business does not have a believable “value creation plan,” PE will either lower the price or pass.
3. Deep Dive: The Valuation Nuance That Matters Most - Data Rights + Proof of Outcomes
Most of the valuation spread in healthcare data and analytics comes down to one combined question:
Do you control something scarce (data and workflow) and can you prove it changes outcomes buyers care about?
Why it matters
Two businesses can have the same revenue and similar “analytics” branding. One sells as a strategic, defensible asset. The other sells as a services firm with some dashboards. The multiple difference can be dramatic.
How this shows up in deal patterns
Across the precedent deals and driver patterns in the data:
- Assets associated with control of integrated records and software and unique datasets linked to outcomes show premium outcomes.
- Assets tied to closing care gaps and measurable payer/provider KPIs are also associated with premium deal narratives.
- Buyers reward businesses that are compliance-ready and embedded in regulated environments, because that reduces “deal risk.”
Why buyers care
Think about what a buyer is really buying:
- Rights: the legal ability to use, analyze, and commercialize the data.
- Durability: confidence the data access will still exist 3-5 years from now.
- Differentiation: evidence competitors cannot easily recreate your dataset or model outputs.
- Economic impact: proof your product helps a payer/provider/pharma customer make or save money in a measurable way.
In healthcare, “we have data” is not enough. Buyers want to know why your data is uniquely valuable and what financial lever it moves.
How to move from a lower-value profile to a higher-value profile (in months, not years)
You usually do not need a massive pivot. You need sharper proof and cleaner structure:
- Tighten your data rights: document permissions, renewal terms, exclusivity (if any), and what happens on termination.
- Productize outcomes reporting: publish a standard “impact report” for each major use case (care gaps closed, risk captured, adherence uplift, readmissions avoided).
- Make defensibility legible: quantify coverage breadth, refresh cadence, longitudinal depth, and linkage quality.
- Reduce dependency: if a single data partner is existential, build backup sources or renegotiate terms.
Mini-table: Lower-value vs higher-value profile
4. What Healthcare Data and Analytics Businesses Sell For - and What Public Markets Show
Here is the cleanest way to use market data:
- Private deals tell you what buyers actually paid for similar assets.
- Public multiples tell you the “reference bands” investors use, but private companies are almost always adjusted for size, risk, and growth.
The key is not to hunt for the highest multiple. It is to understand what profile earns the top end - and what profile gets discounted.
5.1 Private Market Deals (Similar Acquisitions)
In the provided precedent transaction groups:
- Healthcare Data & Analytics Software/Platforms show an average around 3.5x EV/Revenue and median around 3.4x.
- The same group shows a very wide EV/EBITDA picture (average extremely high, median closer to the low 20s), which is a common artifact when EBITDA is small, volatile, or temporarily depressed.
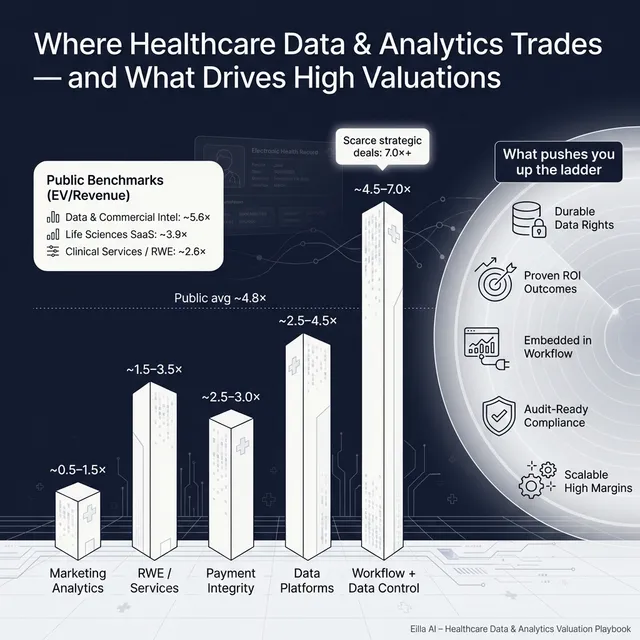
- A practical “working range” for many private healthcare data and analytics assets - especially with mixed software and services - often centers around roughly 2.5x-4.5x EV/Revenue when you triangulate private ranges and public comparables.
Just as important: adjacent categories create a gravity effect:
- Services-heavy clinical and commercialization services can trade lower on revenue multiples unless they have strong margins and defensibility.
- Marketing-tech-like healthcare businesses often trade at much lower revenue multiples.
- Scarce, strategic assets tied to workflows or outcomes can stretch materially above the “core” band when multiple buyers view them as essential.
Private deals - simple benchmark table (illustrative)
These ranges are illustrative - not a promise. Your actual outcome depends on growth, margins, customer quality, defensibility, and process execution.
5.2 Public Companies (Reference Multiples as of mid-to-end 2025)
Public markets provide context, but they are not a direct price tag for private companies. Public multiples embed:
- larger scale
- more diversified revenue
- audited reporting
- daily liquidity
- often stronger margins (or at least clearer visibility)
That said, the public “bands” help founders understand what sophisticated buyers consider reasonable.
Based on the public segment group averages and medians:
- Overall across the dataset: ~4.8x EV/Revenue and ~17.5x EV/EBITDA.
- Healthcare Data Analytics & Commercial Intelligence shows high average EV/Revenue (~5.6x) but low median (~1.5x) - a classic sign of a few high-multiple outliers and many more conservatively valued names.
- Life Sciences Software Platforms (clinical/quality/safety SaaS) cluster around ~3.9x average EV/Revenue with EBITDA multiples around the high teens.
- Clinical research services and tech-enabled RWE trend lower on revenue multiples (~2.6x average) and around low double-digit EBITDA multiples.
- Healthcare IT systems and EMR/data infrastructure are often moderate on revenue multiples (~2.5x average) with EBITDA multiples that can still be meaningful when profitability is real.
Public comps - benchmark table (segment level)
How to interpret public multiples as a private founder
Use public multiples as guardrails, then adjust:
- Downward adjustments are common for smaller scale, customer concentration, uneven growth, limited proof of defensibility, or services-heavy delivery.
- Upward adjustments can happen when your asset is scarce and strategic - particularly if you control unique data, are embedded in workflows, and can prove measurable outcomes.
- The best private outcomes come when you create competitive tension and your story matches what multiple buyer types already want.
6. What Drives High Valuations (Premium Valuation Drivers)
Premium outcomes in this sector are rarely about “nice dashboards.” They are about defensibility, integration, and impact. The premium drivers observed in deals cluster into a handful of themes.
1) Proprietary data and RWE monetization that is actually defensible
Buyers pay more when you can credibly answer:
- What dataset do you control that others cannot easily access?
- How broad is it, how often is it refreshed, and how deep is it over time?
- Can it be linked (in a compliant way) to outcomes and costs?
Practical examples:
- You can show longitudinal cohorts that support RWE studies and are hard to replicate.
- Your data covers a niche population (or setting) that pharma/payers struggle to see elsewhere.
- You have repeatable “data products” that monetize the dataset beyond one-off projects.
2) Demonstrated ability to influence cost of care and payer outcomes
In healthcare, money follows outcomes. Premium valuation narratives often tie directly to:
- closing care gaps
- improving quality scores
- reducing readmissions
- improving adherence
- improving risk capture or medical cost management
Practical examples:
- You can show how your insights changed clinical or outreach behavior and improved KPI metrics.
- You have contracts that price based on delivered value (even partially).
- You can attribute results in a way buyers believe, not just “correlation.”
3) Strategic ecosystem fit - the buyer can plug you into their stack
A strategic buyer pays up when your product becomes a missing piece of their platform:
- you accelerate their roadmap by 18-24 months
- you unlock a channel they already own
- you give them data/workflow control they cannot easily build
Practical examples:
- Your analytics layer integrates tightly with payer/provider systems.
- Your data products strengthen a buyer’s care delivery, pharmacy, or life sciences offering.
- You can articulate a clean “synergy map” in plain English.
4) High gross margin, scalable economics (and proof you can get more efficient)
Premium deals reward businesses that can scale without hiring armies of analysts.
Practical examples:
- Subscription analytics products with standardized pipelines.
- Automation in ingestion, cleaning, and reporting.
- Clear separation of product revenue vs services revenue, with services becoming smaller over time.
5) Regulatory-grade integration and compliance readiness
In healthcare, “diligence comfort” is value. Buyers pay more when they believe:
- you have clean consent and governance
- you can survive an audit
- integration risk is manageable
- regulatory change is not a hidden time bomb
Practical examples:
- Clear HIPAA posture, strong security controls, and consistent contracting.
- Evidence you’ve deployed in highly regulated environments without incidents.
- Transparent policies and documentation that reduce buyer uncertainty.
6) Device-data convergence (when relevant)
If you can connect analytics to proprietary device-generated data or clinically embedded monitoring, defensibility and strategic value can rise.
Practical examples:
- Partnerships with device OEMs that create proprietary telemetry streams.
- Analytics that meaningfully improve adherence, dosing, or monitoring workflows.
The “boring” premium drivers still matter
Even when your story is exciting, buyers still pay more for:
- clean financials and predictable revenue
- diversified customers
- strong retention and expansion
- a leadership bench that can run the company post-sale
- a sales pipeline that is real, documented, and repeatable
7. Discount Drivers (What Lowers Multiples)
Lower multiples are not always about “bad businesses.” Often they are about uncertainty - things a buyer cannot confidently underwrite.
1) Services-heavy delivery without a clear path to productization
If a large portion of revenue depends on custom work:
- gross margins are lower
- delivery risk is higher
- growth is less scalable
- buyers fear customer churn when key people leave
Fix is not “stop services.” It is to productize repeatable components and make services support the product, not replace it.
2) Data rights risk or partner dependency
If a key dataset is:
- non-exclusive
- easily replaced
- controlled by a partner with weak renewal terms
- subject to unclear permissions
…buyers will discount aggressively or require earn-outs.
3) Weak proof of outcomes (especially for payer/provider ROI claims)
In this sector, vague claims like “we improve outcomes” do not survive diligence.
Discount signals include:
- no baseline vs post-implementation measurement
- no customer case studies with numbers
- no attribution logic
- ROI claims that depend on assumptions buyers do not trust
4) Customer concentration and “one whale” economics
A single large payer or health system can create real value - but it also creates negotiating leverage and renewal risk. Buyers often discount when:
- top 1-3 customers represent an outsized share of revenue
- contracts are short
- renewals are not proven
5) Compliance and security gaps
Even a small compliance weakness can become a deal-breaker, or at least a price cut. Buyers discount when they see:
- inconsistent contracting (missing BAAs where needed)
- unclear data handling practices
- lack of security documentation
- unresolved incidents or gaps in controls
6) Messy financials and unclear gross margin
If you cannot explain:
- recurring vs non-recurring revenue
- product vs services margin
- true customer acquisition costs and payback (in simple terms)
- revenue recognition logic
…buyers will assume the worst and lower their offers.
8. Valuation Example: A Healthcare Data and Analytics Company (Fictional)
This is a worked example to show how valuation logic works in practice.
Important: The company and the numbers below are fictional. The valuation range is illustrative - not investment advice, not a fairness opinion, and not a prediction of your sale price.
The fictional company: “ClearHarbor Health Insights”
ClearHarbor is a healthcare data and analytics business with:
- USD 10.0m revenue
- Mix of subscription analytics and implementation services
- Customers: mid-sized payers and value-based provider groups
- Products: claims + clinical data integration, risk and quality analytics, outreach targeting, and RWE-style cohort insights
- Data: combines customer data plus licensed third-party data; some proprietary enrichments
Step 1: Build a core multiple range using market anchors
A practical approach is to triangulate:
- Private healthcare data & analytics platform deals (often clustering around the mid-single-digit revenue multiple range for strong assets, with many landing around 3-4x)
- Public segment reference bands (which include both high-multiple outliers and many lower-multiple names)
- Your company’s profile (software vs services mix, defensibility, growth, margins, customer quality)
For a mixed software + services healthcare data and analytics business at this scale, a defensible core working range is often around:
- 2.5x-4.5x EV/Revenue
That range is consistent with the idea that:
- pure, scaled, high-margin software can be higher,
- services-heavy or marketing-adjacent mixes pull it down,
- strategic scarcity can pull it up.
Step 2: Apply the range to USD 10.0m revenue
Now turn the multiple into an enterprise value (EV) range:
What creates the premium case in this sector?
ClearHarbor gets toward the premium case if it can show:
- durable data rights and unique coverage (not easily replicated)
- measurable impact on payer/provider KPIs that matter financially
- strong gross margin and a product-led delivery model
- compliance-ready posture that reduces diligence risk
- clear strategic fit for multiple buyer types (not just one)
What creates the discounted case?
ClearHarbor lands closer to the low end if:
- services dominate and delivery is highly custom
- the data is mostly licensed and easily replaced
- outcomes claims are not quantified
- customer concentration is high
- compliance documentation is weak
Step 3: What this means for you
Two companies with the same USD 10m revenue can be worth very different amounts because buyers are not paying for “revenue.” They are paying for:
- confidence the revenue will continue
- ability to grow it efficiently
- defensibility of the underlying asset (data + workflow + trust)
Your job pre-sale is to reduce uncertainty and make your premium drivers obvious.
9. Where Your Business Might Fit (Self-Assessment Framework)
This is a simple tool to estimate where you might fall within the valuation spectrum.
How to use it:
- Score each factor 0, 1, or 2
- 0 = weak / unclear today
- 1 = decent but not consistent
- 2 = strong and provable
- Be honest. This is for decision-making, not marketing.
Self-assessment table (0-2 scoring)
Interpreting your total score
- Top band: You look like a premium-leaning asset. Your job is to run a competitive process and tell the story crisply.
- Middle band: You can still have a strong outcome, but you need to shore up 2-3 key proof points (often outcomes evidence and margin mix).
- Lower band: Consider a 6-12 month “value-up” plan before selling, or expect more structure (earn-outs, holdbacks) and lower multiples.
10. Common Mistakes That Could Reduce Valuation
These are avoidable, and they cost founders real money.
1) Rushing the sale
If you go to market before your numbers, story, and diligence materials are ready:
- buyers lose confidence
- timelines slip
- you accept a “good enough” offer because you are exhausted
2) Hiding problems
Every business has issues. Buyers can live with issues. They cannot live with surprises.
If problems surface late:
- trust breaks
- buyers retrade price
- deals fall apart
3) Weak financial records (especially fixable ones)
In this sector, buyers want clean visibility into:
- recurring vs services revenue
- gross margin by product line
- customer retention and expansion
- implementation costs and timelines
If your reporting cannot answer these quickly, your multiple drops because risk rises.
4) Not running a structured, competitive process with an advisor
In practice, competitive tension is one of the biggest drivers of price. A structured process with the right advisor often leads to meaningfully higher purchase prices (commonly cited around 25% better outcomes) because it improves:
- buyer reach
- story quality
- process discipline
- negotiating leverage
5) Revealing the price you want instead of letting the market bid
If you tell buyers “we want USD 10m” you often get USD 10.1m, USD 10.2m - because you killed price discovery.
Let the market speak first. Your job is to create enough buyer interest that the offers compete upward.
Two industry-specific mistakes founders make
- Unclear data rights and consent models: “We think we can use it” is not a diligence-grade answer. Fix this early.
- Overstating clinical or outcomes claims: In healthcare, credibility is everything. If your claims do not survive scrutiny, buyers will discount the entire story.
11. What Healthcare Data and Analytics Founders Can Do in 6-12 Months to Increase Valuation
You do not need to reinvent the company. You need to make value legible, reduce risk, and improve the mix.
A) Improve the “quality of revenue”
- Increase recurring revenue percentage by packaging repeatable services into subscription modules.
- Move customers to longer contracts where possible (even if pricing is similar).
- Add expansion paths (new use cases, new data products, new modules) that drive net retention.
B) Prove outcomes in a way buyers believe
- Create 3-5 standardized case studies with numbers:
- baseline, intervention, result, timeframe
- which KPI moved and why it matters financially
- Build an “impact dashboard” for every major customer category (payer, provider, life sciences).
- If outcomes-based pricing is realistic, test it on one or two contracts - even partial linkage improves credibility.
C) Strengthen data defensibility and diligence readiness
- Inventory every dataset: source, permissions, renewal terms, termination risk.
- Remove single points of failure (backup sources, renegotiate key agreements).
- Package your compliance posture:
- policies, controls, BAAs/DPAs, security documentation, incident response plan
D) Improve gross margin and productization
- Break revenue into “product” vs “services” clearly.
- Identify the top 3 service motions that repeat, then build tooling and templates to deliver them faster.
- Automate data pipelines and reporting where possible to demonstrate operating leverage.
E) Prepare the deal story and materials early
- Build a founder-friendly, buyer-ready narrative:
- what you do, why you win, why it is defensible, why now
- Document pipeline and growth drivers with evidence (not hope).
- Create a clean data room outline before you launch the process.
12. How an AI-Native M&A Advisor Helps
Selling a healthcare data and analytics business is hard because buyers are specialized, diligence is intense, and the valuation spread is wide. The best outcomes come from reaching the right buyers, telling the story crisply, and running a disciplined, competitive process.
An AI-native M&A advisor like Eilla AI helps in three practical ways. First, higher valuations through broader buyer reach: AI can expand the buyer universe to hundreds of qualified acquirers based on deal history, synergy fit, financial capacity, and other signals. More relevant buyers means more competition, stronger offers, and a higher chance the deal closes even if one buyer drops.
Second, initial offers in under 6 weeks: AI-driven buyer matching and connecting, faster creation of marketing materials, and structured diligence support can compress timelines compared to manual-only outreach.
Third, expert advisory, enhanced by AI: you still get experienced human M&A advisors driving strategy and negotiation - but with AI support that improves positioning, buyer targeting, and process execution. The result is “Wall Street-grade” advisory quality without traditional bulge bracket costs.
If you would like to understand how an AI-native process can support your exit, book a demo with one of our expert M&A advisors.
Are you considering an exit?
Meet one of our M&A advisors and find out how our AI-native process can work for you.


