
The Complete Valuation Playbook for IoT Solutions Businesses
A data-driven guide to how IoT solutions businesses are valued and what drives high multiples.

If you are thinking about selling your IoT solutions business in the next 1-12 months, valuation is not a single number - it is a story backed by proof. In IoT, that story gets judged across multiple “lenses” (hardware, software, connectivity, services), and small differences in business model or risk can swing outcomes a lot.
This playbook is built to help you see what IoT solutions businesses actually sell for, what drives higher vs lower multiples, and how to position your business to land closer to the top of the range - using the deal and public market data in the sources, plus practical M&A pattern-recognition from this sector.
1. What Makes IoT Solutions Unique
IoT solutions is not one business. It is usually a stack:
- Devices and edge hardware (modules, gateways, sensors)
- Connectivity (SIMs, MVNOs, private networks, satellite)
- Software (device management, analytics, workflow, vertical apps)
- Implementation and ongoing services (integration, monitoring, field ops)
Buyers do not value “IoT” - they value the economic engine inside your stack. Two companies can both call themselves IoT solutions providers and trade at very different multiples because one is hardware-like (lower gross margins, more working capital, more churn risk) and the other is software-like (high gross margins, recurring revenue, scalable delivery).
The main types of IoT solutions businesses (and why it matters)
From the data, the ecosystem clusters into a few common archetypes:
- Hardware-centric enablement: modules, gateways, device OEMs - typically lower EV/Revenue in public markets (often around ~1.2-1.5x median/average) and valuation often relies on scale and supply chain execution.
- Connectivity platforms: cloud-SIM, MVNO, connectivity management platforms - usually valued on revenue multiples when EBITDA is still negative, with public comps around ~1.2-1.4x (median/average) and higher private deal prints when the business is truly subscription-like.
- System integrators / end-to-end solutions: project-led delivery with software wrapped in - multiples can vary wildly based on how recurring and scalable the revenue really is.
- Vertical telematics platforms: software + devices in fleet/asset, maritime, regulated verticals - the data shows recurring, sticky vertical telematics can earn stronger outcomes than “generic IoT services,” especially when retention is proven.
- Industrial OT/IT and automation services: systems integration and smart city projects - often valued more like services unless you can prove recurring platform economics.
Unique valuation considerations in IoT
Buyers will almost always pressure-test:
- What is truly recurring vs “repeatable”? A signed multi-year subscription is different from “we usually get expansions.”
- Gross margin quality: IoT businesses often hide low-margin hardware pass-through inside “revenue.” Sophisticated buyers will reclassify and normalize.
- Integration friction: if every deployment is bespoke, your revenue is less scalable and more dependent on specific people.
- Security, uptime, and liability: if your platform touches critical operations (fleet safety, healthcare devices, industrial controls), risk management can drive valuation as much as growth.
Key risk factors buyers always check
In IoT, diligence is rarely only financial. Expect deep questions on:
- Device fleet reliability, warranty exposure, and failure rates
- Connectivity dependencies (carrier concentration, roaming costs, MVNO terms, satellite contracts)
- Cybersecurity posture and incident history
- Data handling, privacy, and regulated compliance (especially in healthcare, critical infrastructure, and transportation)
- Customer concentration and contract enforceability (including who owns the relationship - you or the channel partner)
2. What Buyers Look For in an IoT Solutions Business
Most buyers - strategic acquirers and private equity - are trying to answer one simple question:
“Is this a scalable, defensible, recurring cash flow engine… or a people-heavy project business with hardware risk?”
The obvious factors still matter
Even in IoT, the classic drivers remain core:
- Revenue size and growth rate
- Gross margin and EBITDA margin (or a credible path to EBITDA)
- Customer retention (customers sticking around) and expansion (paying more over time)
- Concentration risk (one customer or one partner that controls your fate)
- Quality of financial reporting and predictability
IoT-specific nuances buyers care about
This is where IoT gets different:
- Where you sit in the customer’s “must-have” workflowIf you are tied to compliance, uptime, or safety, customers tolerate price increases and churn less.
- Deployment modelIntegration-light platforms with repeatable onboarding are worth more than bespoke integration-heavy delivery.
- Hardware economicsHardware can be a value-add - but only if it is either (a) high margin, or (b) primarily a “hook” that drives recurring software/connectivity with strong margins.
- Proof of scaleBuyers want evidence like device counts on the network, active endpoints, uptime SLAs, and renewal behavior - not just “pipeline.”
How private equity (PE) tends to think
PE buyers usually model the business as “buy now, improve, sell in 3-7 years.” They care about:
- Entry multiple vs exit multipleIf they buy you at 3.0x revenue, can they sell later at 4.0x because you became more recurring, more profitable, and lower risk?
- Who the next buyer isThey want a clear exit path: a larger strategic, a bigger PE fund, or (rarely) public markets.
- The levers they expect to pull
- Price increases (especially for mission-critical uptime or compliance)
- Cross-sell into the installed base
- Services efficiency (standardize delivery, reduce custom work)
- Cost discipline and operating leverage once growth spend stabilizes
3. Deep Dive: The Single Biggest Valuation Nuance in IoT - “Hardware Revenue” vs “Software-Like Revenue”
If you only remember one thing: in IoT, the mix and “quality” of revenue often matters more than the total revenue.
Two USD 10m revenue businesses can land in totally different valuation bands because buyers care about how that revenue behaves under stress.
How this shows up in the data
You can see a clear pattern:
- Public market categories that are more hardware-like tend to trade around ~0.8x-1.5x EV/Revenue (median/average varies by bucket).
- Business models with software-like gross margins (often 60%+ and sometimes far higher) are repeatedly cited as premium drivers - because they can scale with operating leverage.The premium driver data calls out connectivity businesses showing very high gross margins (for example, 60%+ and in some cases ~85-90% range) as a clear signal of pricing power and low cost-to-serve. That margin structure supports paying “more per dollar of revenue” because each future dollar drops more to profit.
Why buyers care
Hardware and project revenue is often:
- Lower margin
- More volatile (supply chain, component cost swings)
- Working-capital heavy (inventory, receivables)
- Harder to scale without adding people
Software-like revenue tends to be:
- Higher margin
- Stickier (embedded in daily operations)
- Easier to grow with the same team
- More predictable - which reduces buyer risk
How to move from the “lower value” profile to the “higher value” profile
You do not need to abandon hardware. You need to reframe hardware as the distribution layer for recurring value:
- Bundle hardware with multi-year connectivity/software plans
- Shift reporting to show “recurring vs non-recurring” clearly
- Productize implementations (repeatable playbooks, standard pricing)
- Prove retention and expansion in cohorts (what happens to customers 12-24 months later)
Mini-map:
4. What IoT Solutions Businesses Sell For - and What Public Markets Show
Here is the simplest way to use comps:
- Private deals show what buyers have paid for similar businesses (often reflecting strategic value, competition, and deal structure).
- Public comps show a “market temperature check,” but public multiples usually need adjustment for your smaller scale and higher key-person risk.
The data includes both precedent transactions and public trading multiples grouped by IoT segment (largely reflecting mid/end-2025 market context for public comps).
4.1 Private Market Deals (Similar Acquisitions)
Across the precedent transactions data, the overall average and median EV/Revenue is ~2.1x, and overall EV/EBITDA is ~7.4x. But the range by sub-sector is wide, which is exactly the point: “IoT” is not one multiple.
A few clear patterns from the grouped deal data:
- Cloud-native, subscription-like connectivity platforms show higher EV/Revenue averages (around ~4.1x) - but that band can be “optimistic” for smaller, loss-making companies unless retention and the path to profitability are clear.
- Fleet and asset telematics platforms sit in a solid middle band (around ~2.6-2.7x EV/Revenue in the grouped averages/medians) with examples higher when the buyer believes in product expansion and retention.
- Device and OT networking vendors (gateways/routers/edge hardware) tend to be lower to mid (around ~1.7-2.1x EV/Revenue in the grouped averages/medians), with strong outcomes when industrial data visibility and portfolio fit create synergy.
- Industrial automation and systems integration often looks more like services (grouped median ~0.7x EV/Revenue) unless recurring platform economics are proven.
A practical way to view the private market ranges from the grouped data:
These are not “price tags.” They are a map of where buyers have landed when the business model matches the segment.
4.2 Public Companies
Public multiples help you anchor a “reasonable band,” but public markets also price in scale, liquidity, and sometimes very different risk profiles.
From the grouped public data:
- Overall public averages/medians in the dataset are ~5.4x EV/Revenue and ~22.8x EV/EBITDA, but that overall number is distorted by outliers and mixed segments.
- More relevant IoT-adjacent buckets in public markets often cluster lower:
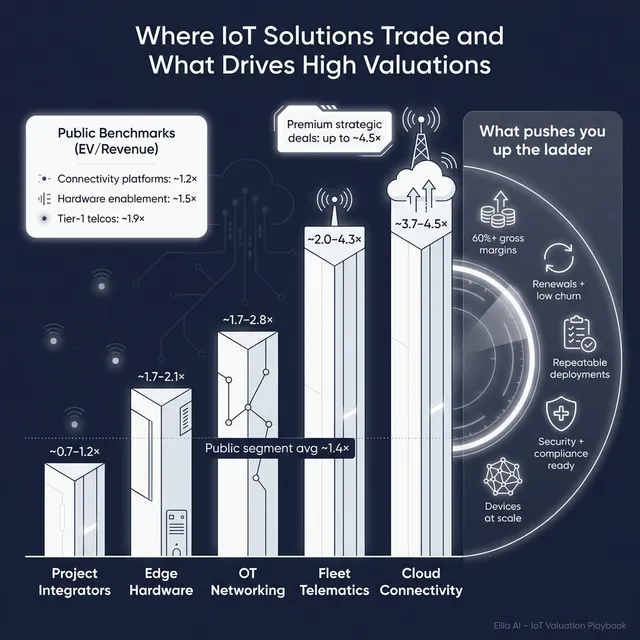
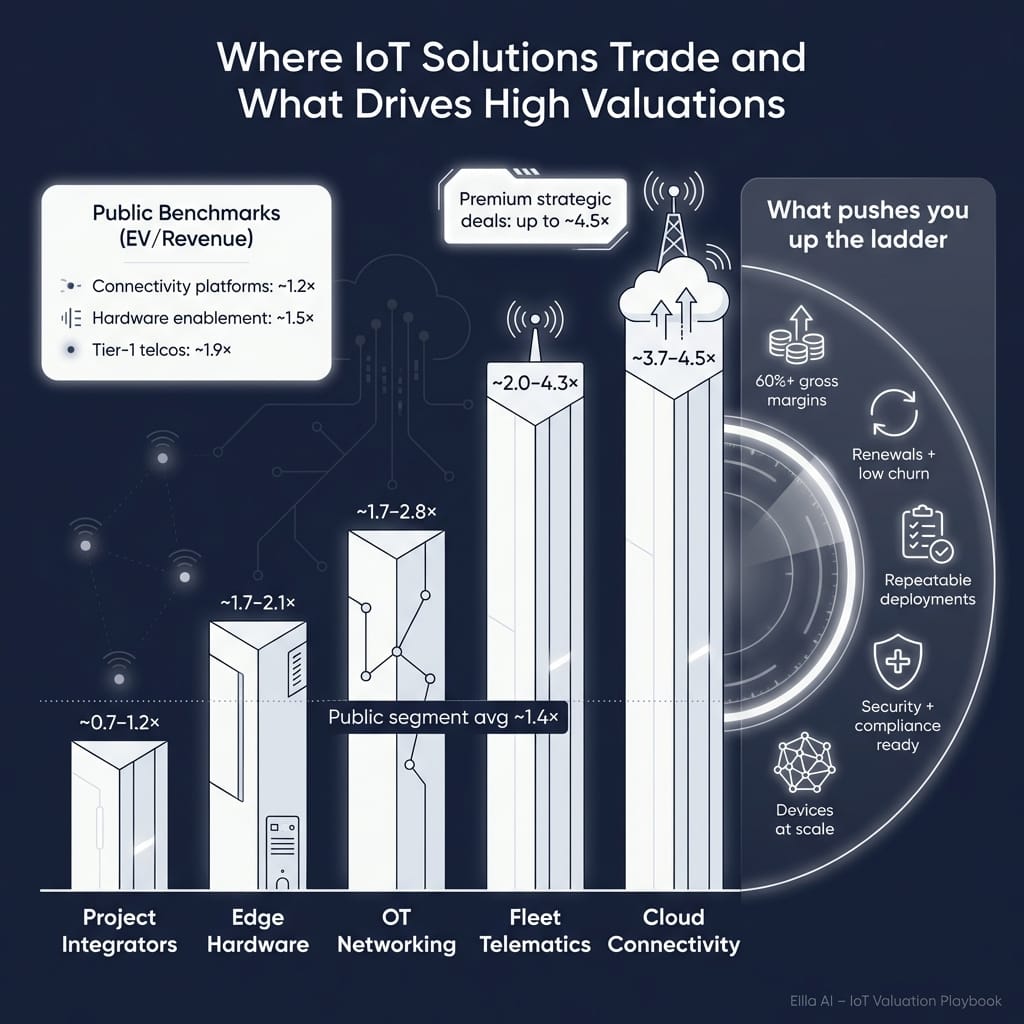
- Hardware-centric IoT enablement: ~1.2x median EV/Revenue, ~17.2x median EV/EBITDA
- IoT connectivity platforms (SaaS/PaaS driven): ~1.4x median EV/Revenue, ~10.0x median EV/EBITDA
- Component/mixed hardware providers: ~0.8x median EV/Revenue, ~8.9x median EV/EBITDA
- Tier-1 telecom operators: ~1.8x median EV/Revenue, ~6.7x median EV/EBITDA
- Non-tier-1 wireless/broadband access: ~1.5x median EV/Revenue, ~15.3x median EV/EBITDA
A founder-friendly interpretation table:
How to use public multiples correctly
Use public comps as rails, not a destination:
- Upper reference band: what the market pays for scaled, lower-risk versions of your model.
- Adjustment factors: private companies typically get adjusted down for smaller scale, customer concentration, less mature reporting, and key-person dependence.
- But sometimes adjusted up: scarce assets with strategic fit, mission-critical deployments, or clear synergy can earn a premium even vs public comps.
5. What Drives High Valuations (Premium Valuation Drivers)
Premium outcomes in IoT are rarely about one metric. They come from a buyer believing three things at the same time:
- your revenue will stick,
- your margins can scale, and
- your business reduces their strategic gap quickly.
Below are the premium drivers pulled from the data, grouped into founder-friendly themes, plus a few “always matter” M&A basics.
Theme 1: Software-like gross margins and scalable delivery
The data repeatedly flags high gross margins in connectivity and services-heavy models as a premium driver, with examples showing margins far above typical hardware integrators. The reason is simple: buyers can underwrite future profit.
What you can do:
- Show gross margin by product line (software, connectivity, hardware pass-through)
- Prove that margins are durable across customers and over time
- Explain what keeps your costs low (cloud-native delivery, automation, carrier terms, standardized onboarding)
Theme 2: Recurring revenue with real stickiness
Premium outcomes show up when the use-case is sticky: fleet, maritime, connected health, and other uptime/compliance-heavy verticals. In the data, deal structures even tie earnouts to retention and platform adoption - a big signal that buyers pay for repeatable usage, not one-time installs.
What you can do:
- Show multi-year contracts, renewal rates, and device counts on your network
- Track customer cohorts (what happens after 6/12/24 months)
- Tie your value to compliance, uptime, safety, or cost savings that are hard to rip out
Theme 3: Vertical specialization where compliance and uptime drive willingness to pay
The data highlights regulated or mission-critical settings (health, maritime, fleet compliance) as premium zones. In these niches, “cheap” is not the main buying decision - risk is.
What you can do:
- Document certifications, SLAs, uptime metrics, and incident response
- Show proof of long-lived deployments (devices active for years)
- Build credible reference customers in the vertical, not scattered pilots
Theme 4: Strategic fit and clear synergy narrative
In industrial data/connectivity and OT networking, strategic buyers paid for adjacency and portfolio completeness. Synergy is not “corporate talk” - it is the buyer seeing a clear cross-sell or product roadmap fit.
What you can do:
- Map exactly how your product fills gaps in likely acquirers’ portfolios
- Quantify cross-sell potential into their installed base (even directional numbers)
- Show your integrations and partner ecosystem to reduce integration risk
Theme 5: Credible growth plan - including adjacent expansion
The data includes examples where buyers rewarded credible expansion (adjacent M&A, product adoption milestones, earnouts tied to growth). Buyers pay for growth when you show execution, not just ambition.
What you can do:
- Prove expansion wins (new verticals, new geographies, new carriers/partners)
- Present a realistic 12-24 month roadmap tied to customer needs
- Show what growth looks like without “heroics” (repeatable sales motion)
Theme 6: EBITDA quality and resilience
Even when revenue multiples are the primary metric (common for smaller IoT platforms), buyers still care deeply about whether your business can become profitable predictably. The data shows premium outcomes clustering around businesses with durable EBITDA margins, especially in infrastructure-like models.
What you can do:
- Explain your path to profitability in simple levers (pricing, support automation, services efficiency)
- Separate growth investment from “must-have” operating costs
- Show credible operating leverage as the installed base grows
The boring basics that still move valuation
Even if they are not “sexy,” buyers pay more when:
- Financials are clean and consistent
- Revenue recognition is understandable
- Leadership depth exists beyond the founder
- Customer concentration is managed
- Security and compliance are documented, not improvised
6. Discount Drivers (What Lowers Multiples)
Most valuation “haircuts” are not philosophical. They are risk pricing. Buyers lower multiples when they fear one of three things:
- revenue will not stick
- margins are not real
- surprises will show up in diligence
Common discount drivers in IoT:
1) Too much services or bespoke work hiding inside “product revenue”
If every deployment requires heavy integration, your business scales like an agency, not a platform. Buyers worry growth requires hiring as fast as revenue.
How to fix:
- Productize implementations
- Standardize pricing and scopes
- Report services as a separate line with clear margins
2) Hardware pass-through inflating revenue
If you resell devices at low margin, EV/Revenue can look artificially low. Buyers will often normalize your revenue to focus on “value-added” revenue.
How to fix:
- Separate hardware revenue and gross margin clearly
- Highlight recurring software/connectivity attach rates
3) Negative EBITDA with no credible bridge to profitability
The example logic in the sources explicitly discounts cloud-native connectivity platforms below higher private prints when EBITDA is negative and scale is limited. Buyers worry you are “buying revenue” with spend.
How to fix:
- Show a simple profitability bridge with 2-3 levers
- Provide proof that cost-to-serve declines as the installed base grows
4) Customer concentration or partner dependency
In IoT, channel partners, carriers, and large enterprise customers can hold leverage. If one relationship drives the business, buyers price that risk aggressively.
How to fix:
- Diversify customers and partners
- Improve contract protections and renewal visibility
- Build direct customer relationships where possible
5) Security and compliance gaps
In mission-critical IoT, a weak security posture can kill deals or force escrow/holdbacks.
How to fix:
- Document security controls, audits, policies, and incident response
- Treat compliance as a product feature, not a last-minute checklist
6) Messy data: churn, retention, device counts, margins not tracked
If you cannot answer basic questions quickly, buyers assume the worst.
How to fix:
- Build a KPI dashboard: retention, churn, ARR (if applicable), device count, gross margin by line, deployment time, support tickets per device
7. Valuation Example: A Fictional IoT Connectivity Solutions Company
This is a worked example to show how valuation logic works in IoT. The company and numbers are fictional. This is not investment advice or a formal valuation.
The fictional company: “NorthBridge Connect”
- Business: cloud-native IoT connectivity platform (multi-carrier SIM management + device lifecycle tools)
- Revenue: USD 10.0m (fictional)
- Gross margin: ~80% (software-like connectivity economics)
- EBITDA margin: negative today (investing in growth)
- Customers: mix of fleet and industrial OEMs, some regulated use-cases, moderate concentration
- Key question: does it deserve a “platform” multiple, or a “connectivity utility” multiple?
Step 1: Build a base multiple range from public and private reference points
From the source logic for a similar type of connectivity platform:
- Public connectivity platform comps provide a conservative floor (in the example logic, roughly ~0.9x-1.7x EV/Revenue as an illustrative mid-band reference).
- Private cloud-native connectivity deals can print much higher (the sources show ~3.7x-4.5x EV/Revenue in that bucket), but the example logic explicitly warns these may embed growth/strategic premiums and assume strong unit economics.
- Because NorthBridge is sub-scale and loss-making, we do not anchor on the highest private prints. We choose a middle range that recognizes high gross margin but prices in scale and profitability risk.
A reasonable “base case” range consistent with the provided logic is:
- 1.8x-3.2x EV/Revenue (illustrative)
Step 2: Apply the multiple to USD 10m revenue
Math is simple:
Step 3: What moves you between these scenarios?
For the same USD 10m revenue, buyers will move you up or down based on proof:
To justify the premium case (toward ~3.7x-4.5x prints):
- Clear retention and expansion (renewals + upsell) with low churn
- Evidence that gross margin stays high as you scale
- Credible path to positive EBITDA without slowing growth too much
- Strong vertical foothold where compliance and uptime matter
What pushes you toward the discount case:
- Revenue is mostly low-margin pass-through
- High customer concentration or weak contract structure
- Unclear unit economics and no path to profitability
- Heavy custom integration per deployment
The point is not the exact number. The point is that valuation in IoT is a function of risk and revenue quality, not just top-line size.
8. Where Your Business Might Fit (Self-Assessment Framework)
Use this to get an honest “where do we likely land?” view before you start a process. Score each factor 0-2:
- 0 = weak / not proven
- 1 = mixed / partially proven
- 2 = strong / clearly proven
How to interpret your score
- High band (mostly 2s): you are closer to premium narratives (buyers compete, fewer “haircuts”)
- Mid band (mix of 1s and 2s): you are in fair market territory, and process quality matters a lot
- Low band (many 0s): you may still sell, but you are likely to see lower multiples, more structure (earnouts), and more diligence pressure
This framework also tells you where 6-12 months of work has the biggest payoff.
9. Common Mistakes That Could Reduce Valuation
1) Rushing the sale
If you start a process without clean numbers and a clear story, buyers will control the narrative. In IoT, that often means they default to “services + hardware risk” unless you prove otherwise.
Fix:
- Prepare a tight data room, KPI pack, and clear segmentation of revenue and margins before outreach.
2) Hiding problems
Issues will surface in diligence. Hiding them destroys trust and usually leads to re-trades (price cuts) late in the process.
Fix:
- Disclose issues early with mitigation plans (security gaps, customer churn, product debt). Buyers can price risk - they cannot price surprises.
3) Weak financial records
In IoT, sloppy reporting is deadly because buyers already worry about blended margins and “what is recurring.”
Fix:
- Separate hardware vs software/connectivity vs services
- Track gross margin by line
- Make revenue recognition and deferred revenue understandable
4) No structured competitive process (or no advisor)
A structured process creates competition, and competition drives price. Research often cited in the market suggests that running a competitive process with an advisor can materially increase purchase price - often quoted around ~25% - because buyers move faster and bid harder when they know they are not alone.
5) Revealing what price you want instead of letting the market bid
If you tell buyers “we want USD 10m,” you often cap your upside. They will come back with USD 10.1m and USD 10.2m instead of telling you what they actually would have paid.
Fix:
- Lead with quality, scarcity, and proof - and let offers define the range.
Two IoT-specific mistakes that often hurt
- Not quantifying the installed base (active devices, churn by cohort, uptime)Buyers need proof your platform is embedded.
- Leaving security/compliance until the last minuteIn regulated verticals, this can cause deal delays, escrows, or lost buyers.
10. What IoT Solutions Founders Can Do in 6-12 Months to Increase Valuation
You do not need a complete reinvention. The goal is to reduce perceived risk and increase proof of revenue quality.
Group 1: Improve “revenue quality” proof
- Break revenue into: recurring software/connectivity, services, hardware pass-through
- Track retention and churn monthly (and by cohort)
- Increase multi-year contracts where possible, even if pricing stays similar
- Push for higher attach rates: software/connectivity bundled with device deployments
Group 2: Make your margins legible and credible
- Report gross margin by line and show trend over time
- Reduce low-margin pass-through where it inflates revenue but not profit
- Standardize delivery to reduce services cost per deployment
- Show a simple profitability bridge (what changes get you to break-even)
Group 3: Reduce buyer anxiety about delivery and dependence
- Productize implementations (repeatable onboarding, standard scopes)
- Build a second-line leadership bench (sales, delivery, product, security)
- Document core processes: support, incident response, deployment playbooks
- Reduce customer and partner concentration where you can
Group 4: Strengthen the “strategic buyer” narrative
- Map 20-50 likely buyers and why you fit their roadmap
- Build integrations that lower integration risk for acquirers
- Collect proof points: case studies tied to compliance, uptime, and ROI
- If you have regulated vertical traction, package it as a “defensible niche,” not “one vertical we tried”
If you do this well, you move from “nice IoT project business” to “scalable platform with defensible recurring economics” - and that is what drives multiple expansion.
11. How an AI-Native M&A Advisor Helps
Selling an IoT solutions business is hard because the buyer universe is fragmented. Some buyers want hardware capabilities, some want connectivity scale, some want vertical SaaS-like platforms, and many are only active in specific geographies or end markets. The biggest valuation unlock is often getting in front of the right set of buyers at the same time.
Higher valuations through broader buyer reach: an AI-native process can expand the buyer universe to hundreds of qualified acquirers based on deal history, synergy fit, and financial capacity. More relevant buyers means more competition, stronger offers, and more options if one buyer drops late in the process.
Initial offers in under 6 weeks: AI-driven buyer matching, faster outreach, and rapid creation of high-quality materials can compress timelines. When buyers get the right information early - clearly segmented revenue, margins, retention proof, and a crisp story - they move faster.
Expert advisory, enhanced by AI: the best outcomes still require experienced human M&A judgment - positioning, negotiation, and running a competitive process. AI improves the speed and coverage, while senior advisors bring credibility with acquirers and help frame your business in the buyer’s language with Wall Street-grade materials - without traditional “bulge bracket” costs.
If you’d like to understand how our AI-native process can support your exit, book a demo with one of our expert M&A advisors.
Are you considering an exit?
Meet one of our M&A advisors and find out how our AI-native process can work for you.


