
The Complete Valuation Playbook for Materials Testing Businesses
A guide to what materials testing businesses sell for today and how to think about your company's valuation.

If you run a materials testing business, you are in a sector buyers care about: safety, infrastructure, compliance, and quality do not go out of fashion. At the same time, the industry is consolidating - global TIC (testing, inspection, certification) groups, engineering consultancies, and private equity are all rolling up regional labs and specialist firms.
That makes the next 1-12 months an important window. Whether you actually sell or not, you should understand how buyers think about value in materials testing, what drives higher versus lower multiples, and what you can realistically improve before a process.
This playbook will walk you through:
- What materials testing businesses actually sell for (with data).
- What pushes you to the top or bottom of the multiple range.
- A worked valuation example on USD 10m revenue.
- A practical self-assessment and a 6-12 month action plan.
1. What Makes Materials Testing Unique
Materials testing is not a generic “services” category. It sits at the intersection of engineering, regulation, and operations. That creates very specific valuation dynamics.
1.1 Main business models in materials testing
Most privately held businesses in this space fall into one or more of these buckets:
- Construction materials labs
- Concrete, asphalt, aggregates, soils, steel, rebar testing.
- Work for contractors, developers, government agencies, and ready-mix plants.
- Mix of project-based work and framework contracts.
- NDT & asset integrity services
- Non-destructive testing of steel structures, pipelines, tanks, bridges, industrial plants.
- Often on-site work with field crews and specialist equipment.
- Strong links to oil & gas, power, industrials, and infrastructure owners.
- Environmental and geotechnical testing
- Contaminated land, groundwater, geotechnical investigations, environmental monitoring.
- Work closely with engineering consultants and infrastructure clients.
- Specialist metrology and materials characterisation
- High-end particle size, surface area, porosity, and other lab analyses.
- Often serving advanced manufacturing, pharmaceuticals, and research customers.
- Can show very high gross margins when expertise and equipment are unique.
Many businesses are hybrids: labs plus site testing plus some advisory or consulting.
1.2 Unique valuation considerations
Valuing a materials testing company is not the same as valuing a software business or a generic contractor. Buyers focus on a few sector-specific issues:
- Regulatory dependence
- A big part of demand is driven by building regulations, safety standards, and environmental rules.
- When your tests are “must-have to sign off a bridge or building”, buyers see you as more defensible than a nice-to-have consultancy.
- Capex and lab intensity
- High-spec equipment, lab fit-out, and accreditations are not cheap.
- Buyers look closely at how capital-intensive your model is and how well you utilise equipment across multiple shifts and sites.
- Mix of recurring vs project revenue
- Framework agreements with government agencies, utilities, or big contractors are valued more highly than one-off test orders.
- Recurring compliance work (e.g. ongoing asset integrity, annual inspections) is especially attractive.
- Talent and accreditation risk
- Senior engineers, signatories, and key lab managers are often “irreplaceable” in practice.
- Accredited methods (ISO, national accreditation bodies) and your track record in audits heavily influence risk perception.
1.3 Key risk factors buyers always check
Expect buyers to drill into:
- Customer concentration in a single contractor, developer, or sector.
- Exposure to cyclical segments (e.g. residential construction) vs core infrastructure and public projects.
- Quality issues, disputes, or claims linked to test failures or mis-certification.
- Safety, site incidents, and insurance history for field testing and NDT.
- Dependency on one or two senior people for technical sign-off, client relationships, or sales.
The more you can show robust systems, broader relationships, and must-have compliance roles, the further you move away from being seen as a “basic lab” and toward a premium asset.
2. What Buyers Look For in a Materials Testing Business
Buyers - both strategic acquirers and private equity - all start with the same basic questions:
- How big is it?
- How fast is it growing?
- How profitable is it?
- How predictable and defendable is that profit?
In materials testing, they layer some specific lenses on top.
2.1 The obvious (but important) basics
- Scale
- Revenue level, lab network, equipment base, and geographic reach.
- Bigger platforms with multi-region coverage are easier for buyers to bolt into their own networks.
- Growth
- Historical revenue growth and near-term pipeline.
- Buyers pay more for businesses growing strongly in attractive segments (infrastructure, industrials, renewables) than flat or declining labs.
- Profitability
- EBITDA margin is a central metric. Many deals in related testing and consulting segments cluster around high single-digit to mid-teens EBITDA margins.
- Clear, stable margins support higher EV/EBITDA multiples.
- Cash conversion
- How quickly you turn profit into cash after capex.
- Slow collection from contractors or heavy capex needs lower valuation.
2.2 Sector-specific nuances buyers focus on
- Service mix: lab vs field vs advisory
- Pure lab work can be commoditised if you are one of many local players.
- Field-heavy NDT or integrity services can be lumpy and people-dependent.
- Advisory/compliance niches (e.g. complex building performance, high-end analysis) can command premium margins and multiples when gross margins are high.
- Regulated, mission-critical roles
- Fields, with highly regulated, must-have services and gross margins near 100%, clear that at revenue multiples above 2x and up to ~4.5x.
- When buyers see you as a gatekeeper to compliance, they pay more.
- Customer and contract quality
- Long-term framework contracts with public authorities, infrastructure owners, or global OEMs are valued more than small-ticket, one-off jobs.
- Buyers will discount if revenue is driven by tender-driven, price-sensitive one-off work.
- Accreditation and reputation
- Coverage across standards (ISO, national standards, specialist methods).
- Audit history, lab inter-comparison results, and how often you are used as a preferred or reference lab.
2.3 How private equity thinks about materials testing
Private equity (PE) buyers are now very active in TIC and engineering services. Their mental model is simple:
- Entry multiple vs exit multiple
- They might acquire you at, say, 8-10x EBITDA, aiming to exit at a higher multiple.
- To justify this, they want a clear story: more scale, better margins, more recurring revenue, and a more “platform-like” business in 3-7 years.
- Who they sell to later
- Larger global TIC groups.
- Bigger PE funds doing larger roll-ups.
- Occasionally public markets if the platform gets large enough.
- Levers they expect to pull
- Price increases where you are under-priced relative to compliance value.
- Cross-selling: offering more tests and services to the same clients.
- Geographic expansion or lab network optimisation.
- Operational efficiencies: utilisation of labs and crews, shared services, better procurement.
If you already look like a mini-platform they can scale (not just a local lab), PE will lean toward the higher end of the valuation range.
3. Deep Dive: Mission-Critical Compliance vs Commodity Testing
One of the biggest valuation swings in materials testing comes from a simple question:
Are you a mission-critical compliance partner or a commodity test provider?
3.1 Why this nuance matters
In the deal data, we see:
- Specialized, regulated advisory and compliance businesses with very high gross margins achieving revenue multiples around 2.4x to 4.5x.
- More generic testing and project management firms clearing closer to 0.8x-1.8x revenue, even when they are decent businesses.
The market is clearly saying: deep, must-have compliance expertise is worth a lot more than a basic lab that competes mainly on price and turnaround time.
3.2 How it shows up in numbers
Compare these profiles:
- High-value profile
- Gross margins in the 50-80% range or higher in certain advisory lines.
- Double-digit EBITDA margins.
- Services tied directly to legal or regulatory sign-off (e.g. structural safety, fire safety, accessibility, high-risk materials).
- Recurring inspections, ongoing monitoring, and statutory reporting.
- Lower-value profile
- Gross margins squeezed by price competition.
- Mixed or low single-digit EBITDA margins.
- Work mostly on builder or contractor instructions, easily switched to other labs.
- Few long-term contracts, many small one-off jobs.
You can see this pattern in the spread of revenue multiples: from sub-1x revenue for service-heavy, competitive businesses, up to 3x+ for specialised, high-margin players.
3.3 Moving from “left column” to “right column”
You do not need to turn your business into a pure advisory firm, but you can shift your profile:
- Productise compliance-heavy services
- Turn ad hoc advice into defined service packages: annual structural integrity reviews, full building performance audits, long-term corrosion monitoring programs.
- Lean into statutory roles
- Where regulations allow, position your firm or key staff as recognised inspection bodies or signatories, not just “one more lab”.
- Raise prices where you are clearly under-charging
- Many materials testing firms underprice high-risk, high-liability work.
- Buyers like to see evidence that you can and do charge appropriately when the test is critical.
- Invest in documentation and proof
- Clear procedures, accreditations, audit trails, and case studies that show your role in safety and compliance.
- This turns “we think we are important” into “here is hard evidence that clients and regulators rely on us”.
3.4 Simple comparison: lower vs higher-value profile
If you feel more like the left column today, your 6-12 month plan should explicitly aim to add more right-column features before a sale.
4. What Materials Testing Businesses Sell For - and What Public Markets Show
In this section we translate the data into something practical:
- What comparable private deals and groups of transactions tell us.
- How public companies in and around materials testing trade.
- How to use those ranges as a founder.
Remember: all ranges below are illustrative, not a prediction of what your business will sell for.
4.1 Private Market Deals (Similar Acquisitions)
From the grouped deal data:
- Across all sectors, average and median EV/revenue for private deals sit at roughly 1.8x.
- For Testing, Inspection, Certification (TIC) & Materials/Asset Integrity Services specifically, the averages cluster around:
- EV/revenue: roughly 1.6x-2.2x (median around 1.6x).
- EV/EBITDA: roughly 9.6x-10.6x.
A simple way to summarise for materials testing founders:
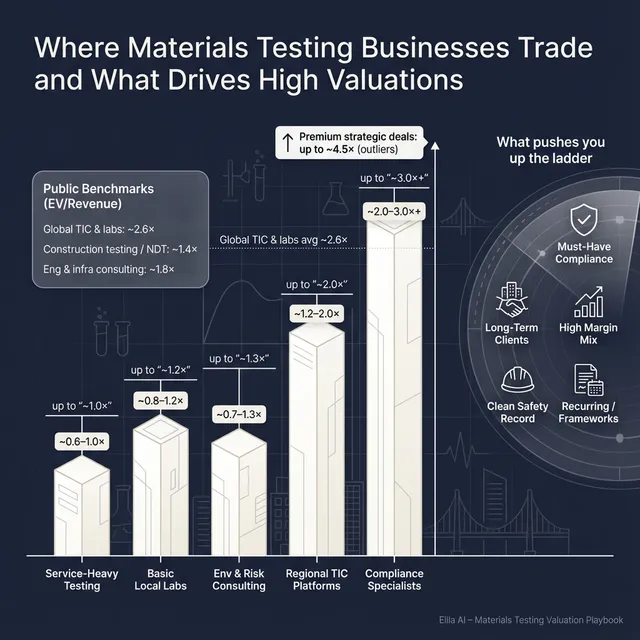
- Basic or subscale labs: often cluster around 0.8x-1.2x revenue.
- Solid regional TIC platforms with decent margins: can justify around 1.2x-2.0x revenue and roughly 8x-11x EBITDA.
- Niche, mission-critical compliance specialists with strong margins: can push 2.0x-3.0x+ revenue and double-digit EV/EBITDA.
You can think of the private market like this:
Again, these are broad ranges that move up or down based on growth, margins, risk, and strategic fit.
4.2 Public Companies
Public markets give another reference point. They are usually not directly comparable to a private mid-market lab, but they set the “ceiling” of what the best businesses can trade at.
From the grouped public data (as of mid/late 2025):
- Global TIC & third-party labs:
- Average EV/revenue around 2.6x.
- Average EV/EBITDA around 16.5x.
- These are large, diversified, global platforms.
- Construction materials testing, NDT & asset integrity services:
- Average EV/revenue around 1.4x, median closer to 0.9x.
- Average EV/EBITDA around 9.7x, median 7.1x.
- Engineering & infrastructure consulting:
- Average EV/revenue around 1.8x (median 1.6x).
- Average EV/EBITDA around 10.3x (median 10.7x).
- Geotechnical contractors & ground engineering:
- EV/revenue often around 0.5x-0.6x.
- EV/EBITDA averages are surprisingly high (mid-teens) because margins are lower and earnings more volatile.
Here is a simplified summary:
4.3 How you should use public multiples
For a privately held materials testing business:
- Think of public multiples as upper and lower “rails”, not a direct price tag.
- Public companies benefit from:
- Bigger scale.
- Diversification across geographies and end markets.
- Liquidity and index investors.
- So a mid-sized private lab will usually price at a discount to the direct public peer multiple, unless it is a scarce, highly strategic target.
A practical rule of thumb:
- If a public peer trades at 1.5x revenue, a private business of similar quality and lower scale might reasonably clear somewhere in the 1.0x-1.3x range in a competitive sale.
- If your business is weaker on growth, margins, or risk profile, you drift toward the lower side or below.
- If you are unusually strategic (e.g. unique niche, critical accreditations, key geography) you may compress the discount significantly.
5. What Drives High Valuations (Premium Valuation Drivers)
Now the good news: there are clear patterns in the data about what pushes materials testing businesses toward the top of the range.
Below are key premium drivers, combining the observed deal data with broader sector experience.
5.1 Regulated, mission-critical compliance niches
Seen in deals like Acceo and Vega Engineering:
- Extremely high gross margins (sometimes 80-100% in advisory/compliance lines) and solid EBITDA margins.
- Services tied directly to building code compliance, safety, or legal obligations.
Why buyers pay up:
- Clients cannot skip these services without breaking the law or putting safety at risk.
- Price is a smaller part of the decision; expertise and reliability matter more.
- Revenue is less cyclical and more recurring.
What you can do:
- Identify where you already play a “must-have” role - e.g. structural monitoring, fire safety, asbestos, critical material performance tests.
- Package and brand those services separately, with proper accreditation and documentation.
- Raise prices gradually where you see clear under-pricing relative to risk and expertise.
5.2 Strong unit economics and improving margins
In higher-multiple deals we see:
- Good gross margins (often 40-60%+).
- EBITDA margins in the low-to-mid teens or better.
- Clear margin improvement over time.
Why this matters:
- Buyers are buying future cash flows, not just revenue.
- Seeing margin expansion at scale tells them the model has operating leverage, not just growing costs.
What you can do:
- Track and report gross margin and EBITDA by service line (lab tests, field testing, advisory).
- Tackle obvious leakage: under-priced tests, overtime, low utilisation of expensive equipment.
- Build a 3-year story of margin improvement, even if it is modest - buyers love trend lines.
5.3 Long-tenure brand and institutional relationships
- Long histories, strong brands, and relationships with public-sector and blue-chip clients support double-digit EV/EBITDA multiples.
Why buyers pay up:
- Institutional clients are slow to move and sensitive to trust and track record.
- Multi-year framework agreements and repeat work reduce revenue risk.
- A long, clean history is difficult for new entrants to replicate.
What you can do:
- Capture data on client tenure and repeat work (e.g. how many top clients have been with you 5+ or 10+ years).
- Highlight framework contracts and master service agreements clearly in marketing materials.
- Show examples where your firm has worked across multiple project cycles or asset lifetimes.
5.4 Clear synergy story for strategic acquirers
- Buyers explicitly talked about cost synergies and revenue cross-sell.
- That supported multiples like 15x EBITDA pre-synergies, dropping to lower levels once synergies are included.
Why this matters:
- Strategic buyers (large TIC, engineering, or construction groups) can justify paying more if they can clearly see:
- Cross-selling (selling more tests/services to your clients).
- Shared labs and back office.
- Stronger local market position.
What you can do:
- Map how you could plug into likely buyers: geographic gaps, service gaps, or accreditations they lack.
- Quantify a simple synergy story in your materials (e.g. “if you cross-sell X services into Y clients, that is an extra Z million in revenue”).
- Be ready to discuss integration in practical terms, not just buzzwords.
5.5 Regulatory cleanliness and “easy to close” profile
- Clean regulatory approvals, court sanctions, and fully funded cash consideration.
- Well-prepared financials and strong governance.
Why buyers pay up:
- Complexity, litigation, and messy compliance issues eat management time and create deal risk.
- The easier you are to diligence and close, the more competitive and confident bids will be.
What you can do:
- Fix obvious compliance gaps (health and safety, environmental, lab accreditations) before going to market.
- Clean up corporate structure, contracts, and employee documentation.
- Prepare quality financial information (clean P&L, balance sheet, and key KPIs) so buyers’ questions are easy to answer.
5.6 The “obvious” but still crucial drivers
Even though they sound generic, they are heavily reflected in the data:
- Consistent growth - flat or declining revenue quickly pushes you toward the lower end of the multiple range.
- Diversified customer base - not overly dependent on one or two customers or a single subsector.
- Strong second tier of management - reduces key-person risk and makes integrations smoother.
- Clean financials and systems - reliable numbers, no hidden liabilities, no surprise related-party issues.
These basics are often the difference between a good deal and a frustrating, heavily discounted one.
6. Discount Drivers (What Lowers Multiples)
Now the tougher part: what drags valuation down.
Many materials testing businesses sit at the lower end of headline multiples not because they are “bad”, but because buyers see risk, complexity, or limited upside.
6.1 Common discount factors
- Project-only, transactional revenue
- Very little recurring or framework work.
- Heavy dependence on tenders and lowest-bid wins.
- Customer and sector concentration
- One contractor or developer accounting for 25-40% of revenue.
- Heavy exposure to a single cyclical sector, such as private residential construction.
- Low or volatile margins
- EBITDA margins below 10%, or wildly fluctuating year to year.
- Suggests either poor pricing power or weak cost control.
- Subscale and key-person dependence
- Business grinds to a halt if one senior engineer, technical signatory, or rainmaker leaves.
- No clear second tier to lead operations post-deal.
- Limited accreditation or quality issues
- Narrow accreditation scope, failed audits, or poor proficiency testing results.
- Any history of serious quality failures or claims tied to test results.
- Messy financials
- Inconsistent revenue recognition on long-term contracts.
- Personal expenses running through the business.
- Poor separation of business and personal assets (properties, vehicles, etc.).
- Weak documentation and systems
- No central CRM, inconsistent project records, limited KPI tracking.
- Makes diligence slow and raises questions about control.
- High capex with poor utilisation
- Big investments in equipment or labs that are under-utilised.
- Raises concerns about true cash flow.
- Unresolved legal, safety, or environmental issues
- Ongoing disputes, claims, or investigations tied to your work.
- Buyers will often price in a “risk haircut” or demand stricter deal terms.
The good news: most of these are fixable or at least improvable over 6-12 months.
7. Valuation Example: A Materials Testing Company
To make this concrete, let’s walk through a simplified example.
7.1 Meet “NorthRock Materials Testing” (fictional)
- Business: Regional materials testing and inspection provider.
- Services: Construction materials lab testing, field density and compaction testing, some structural monitoring and advisory.
- Revenue: USD 10m (fictional).
- EBITDA margin: 15% (USD 1.5m).
- Profile: Accredited labs, good local reputation, serving a mix of contractors and public infrastructure clients.
This example is fictional and the valuation ranges are illustrative, based on the data patterns discussed earlier. It is not investment advice or a formal fairness opinion.
7.2 Step 1 - Selecting relevant comps and bands
From the earlier data, relevant segments and ranges include:
- Global TIC & third-party labs:
- Around 2.2x-3.3x revenue for large, global platforms.
- NorthRock is much smaller, so we treat this as an upper reference, not a direct multiple.
- Construction materials testing, NDT & asset integrity services:
- Around 0.8x-1.4x revenue and mid-single to low double-digit EV/EBITDA.
- Very relevant to NorthRock.
- Engineering & infrastructure consulting:
- Roughly 1.0x-1.9x revenue and 10x-11x EBITDA.
- Also relevant, since NorthRock has consulting-like elements.
- Private deals in TIC & materials/asset integrity services:
- Revenue multiples from roughly 1.0x up to around 2.9x, with many deals in the 1.2x-2.0x zone for decent regional platforms.
We ignore outliers like very high-multiple software-like businesses or heavy construction materials manufacturers.
7.3 Step 2 - Narrowing to a core multiple range
Given NorthRock’s profile:
- Mid-sized, not a global platform.
- Solid margins and accreditations, but not ultra-specialised like Acceo.
- Reasonable growth and diversified client base.
A core revenue multiple range might be:
- Lower bound: 1.2x revenue (reflecting regional TIC/consulting peers, private deal medians).
- Upper bound: 2.0x revenue (allowing some premium for good margins, compliance role, and strong reputation, but still below global TIC leaders).
Applied to USD 10m revenue:
- EV at 1.2x = USD 12m.
- EV at 2.0x = USD 20m.
Now we can layer in scenarios.
7.4 Step 3 - Scenarios for NorthRock
How would NorthRock land in each?
- Conservative / lower end (1.2x)
- Growth is modest or flat.
- Mix is heavily project-based, limited recurring contracts.
- Some customer concentration or margin volatility.
- Still a solid business, but with clear risk factors.
- Core range (1.4x-1.8x)
- Reasonable growth, diversified clients, decent split of recurring work.
- Clear accreditations and good safety/quality record.
- EBITDA margins in the mid-teens with evidence of improvement.
- Premium scenario (2.0x)
- Strong growth in attractive infrastructure or industrial segments.
- High share of framework and recurring compliance work.
- Clear premium features (mission-critical roles, strong margins, synergy story for acquirers).
- Multiple serious bidders around the table, including a strategic buyer.
You could also cross-check with EBITDA multiples. If NorthRock’s EBITDA is USD 1.5m:
- At 8x EBITDA: EV = USD 12m.
- At 10x EBITDA: EV = USD 15m.
- At 12x EBITDA: EV = USD 18m.
These align reasonably with the revenue-derived range, which is what you want in a “sanity check”.
7.5 What this means for you
The main lesson is not whether your business is worth 1.4x or 1.6x revenue today.
The lesson is:
- Two materials testing businesses with USD 10m revenue can justifiably be worth very different amounts, depending on:
- Mix of recurring vs project work.
- Margin quality and trend.
- Specialisation and compliance role.
- Risk profile and buyer fit.
Your job over the next 6-12 months is to move your profile toward the premium scenario and away from the discount one.
8. Where Your Business Might Fit (Self-Assessment Framework)
You do not need a full valuation model to understand roughly where you sit in the spectrum.
Here is a simple scoring framework you can run with your team.
8.1 How to use it
- For each factor group, score yourself 0, 1, or 2.
- 0 = weak.
- 1 = okay / mixed.
- 2 = strong.
- Be brutally honest. This is for you, not for a pitch deck.
8.2 Interpreting your total score
Add up your points (maximum 12):
- 0-4 points - “Fix before you sell”
- You are likely in the lower band of multiples.
- Rushing to sell now risks leaving a lot of value on the table.
- Focus on improving fundamentals and risk profile.
- 5-8 points - “Core market”
- You sit roughly in the fair market range for your segment.
- The right process can still create strong competition and a good outcome.
- Targeted improvements can nudge you into a premium position.
- 9-12 points - “Premium-ready”
- You have many of the features seen in higher-multiple deals.
- With a well-run process and strong positioning, you could justify the top end of realistic ranges.
The goal is not to hit 12/12 overnight, but to identify where each extra point moves the valuation needle most.
9. Common Mistakes That Could Reduce Valuation
Even good businesses can get bad outcomes if the process is mishandled. Here are pitfalls to avoid.
- Rushing the sale
- Going to market without clean numbers, a clear narrative, or basic preparation leads to confusion, delays, and lower bids.
- Hiding problems
- Quality issues, safety incidents, or disputes will surface in due diligence.
- If buyers feel you have been hiding issues, trust collapses and valuations follow.
- Weak financial records
- Incomplete P&Ls, messy job costing, and unclear margin reporting make buyers nervous.
- This is especially damaging when you could improve margins in 6-12 months with simple fixes.
- No structured, competitive sale process
- Running a process with a single buyer or a handful of “friendly” conversations typically leaves money on the table.
- Research and market experience suggest that a structured, competitive process with a professional advisor can increase purchase prices by around 25% versus ad hoc approaches.
- Revealing your target price too early
- Telling buyers “we are looking for around USD 10m” anchors them.
- Instead of discovering the true market-clearing price, you will get offers at USD 10.1m, 10.2m, etc., even if they might have paid more.
- Industry-specific mistake: ignoring accreditations and quality systems
- Letting accreditations lapse, failing to expand scope, or having poor audit history will directly hurt multiples.
- Buyers see this as risk and extra work.
- Industry-specific mistake: locking into low-margin contracts before a sale
- Signing long-term, low-margin deals to “show growth” can backfire.
- Buyers will value those contracts at their true economic contribution, not the headline revenue.
Being aware of these traps lets you avoid giving buyers easy reasons to push price down or add unfriendly terms.
10. What Materials Testing Founders Can Do in 6-12 Months to Increase Valuation
You do not need to reinvent your business to move the valuation needle. But you do need a focused plan.
Think in three buckets: improve the numbers, improve the risk profile, and improve the story.
10.1 Improve the numbers (without crazy bets)
- Tighten pricing on critical services
- Review pricing for high-liability, mission-critical tests and advisory work.
- Even small increases on these lines can lift margins meaningfully.
- Improve gross margins and utilisation
- Rationalise low-margin services or customers if they tie up too much lab or field time.
- Push for better scheduling, shift planning, and use of equipment.
- Reduce obvious leakage
- Charge appropriately for rush work, out-of-hours site visits, and re-tests caused by client errors.
- Clean up write-offs and adjust processes so they are less frequent.
If you can demonstrate EBITDA margin improvement of even 1-2 percentage points over a year, your story becomes more compelling.
10.2 Improve the risk and revenue profile
- Grow recurring and framework work
- Focus sales efforts on winning or expanding framework agreements with infrastructure owners, utilities, and government agencies.
- Try to extend contract terms where possible and broaden scope.
- Diversify your customer and sector mix
- Avoid being over-reliant on a single contractor or development segment.
- Put effort into more resilient sectors like maintenance, asset integrity, and public infrastructure.
- Strengthen accreditations and quality systems
- Complete any overdue accreditation work and expand scope where it supports higher-margin services.
- Run internal audits and proficiency tests so you can present a clean quality record.
These steps move you away from discount drivers and closer to premium patterns.
10.3 Improve the story and data
- Build a simple KPI dashboard
- Monthly revenue by segment, gross margin by service, EBITDA margin, utilisation, client concentration, and safety metrics.
- Buyers love easy-to-understand dashboards.
- Document long-term client relationships
- Highlight clients you have served for many years, especially institutional ones.
- Prepare short case studies that show how your work supports safety and compliance.
- Clarify your strategic positioning
- Decide how you want to be seen: “regional TIC platform”, “specialist compliance lab”, “asset integrity partner”, etc.
- Align marketing materials and your management presentation to that narrative.
10.4 Get deal-ready operationally
- Clean up the corporate structure
- Separate personal assets from the business.
- Clarify ownership of any properties, vehicles, or IP used by the company.
- Resolve known issues early
- Settle manageable disputes where you can.
- Fix obvious safety or compliance gaps rather than leaving them as open questions.
- Engage with an advisor early
- An experienced M&A advisor can help you shape the story, choose the right buyers, and time the process.
- Even a light “exit readiness” review 6-12 months out can be hugely valuable.
You do not need to do everything. Focus on the 3-5 actions that most directly address discount drivers or strengthen premium ones for your specific business.
11. How an AI-Native M&A Advisory Helps
Running a high-quality sale process for a materials testing business is hard work: you still have a business to run while juggling buyers, data requests, and negotiations.
This is where an AI-native M&A advisor like Eilla AI can tilt the odds in your favour.
11.1 Higher valuations through broader buyer reach
Traditional processes often stop at the buyer list your advisor already knows. AI can:
- Map hundreds of potential acquirers worldwide based on deal history, services, geographies, and strategic fit.
- Filter by real-world signals: prior acquisitions in TIC and engineering, financial capacity, and integration track record.
- Turn that into a targeted outreach program that creates more competition and better odds of a strong price.
More relevant buyers means more competitive tension, better offers, and a higher chance of closing even if one buyer drops out.
11.2 Initial offers in under 6 weeks
AI can compress the early stages of a process:
- Drafting sharp, data-driven marketing materials and buyer messages.
- Matching and prioritising buyers quickly.
- Streamlining Q&A and document preparation in data rooms.
The result: serious conversations and initial offers significantly faster than a manual-only process, which is crucial if you have a limited window or want to minimise distraction from running the business.
11.3 Expert advisory, enhanced by AI
Technology alone is not enough. Eilla AI combines:
- Human M&A advisors with decades of deal experience in services and industrial sectors.
- AI-powered tools that help us analyse your numbers, frame your story in buyer language, and anticipate diligence questions.
- Professional, “Wall Street-grade” materials and positioning, without the traditional bulge-bracket fee structure.
You get the credibility and judgement of seasoned advisors, with AI doing the heavy lifting in the background.
If you would like to understand how an AI-native, data-driven process could support your exit in materials testing - from valuation thinking through to buyer outreach and due dilligence support - book a demo with one of Eilla AI’s expert M&A advisors. We can walk through your specific situation and help you decide what to do next.
Are you considering an exit?
Meet one of our M&A advisors and find out how our AI-native process can work for you.


