
The Complete Valuation Playbook for Patient Monitoring Businesses
A practical guide to how patient monitoring businesses are valued and what drives high multiples.

If you run a patient monitoring business and you might sell in the next 1-12 months, valuation is not a “math problem” - it is a story + risk profile, anchored to comps, then negotiated by people with incentives.
This sector is also in a very “buyer-active” phase: hospitals are under staffing pressure, payers keep pushing care into the home, and strategics are still hunting for differentiated data, diagnostics, and workflow assets that can plug into their distribution. That creates real upside - but only if you know how buyers bucket you.
This playbook is built to do three things: show what patient monitoring businesses actually sell for, decode what drives higher vs lower multiples, and give you a self-assessment and 6-12 month action plan.
1. What Makes Patient Monitoring Unique
Patient monitoring is not one industry - it’s several sub-industries that look similar on the surface but price very differently.
The main “types” of patient monitoring businesses
Most companies fall into one (or a blend) of these buckets:
- Hospital-grade monitoring equipment (multi-parameter monitors, sensors, bedside systems, diagnostics hardware)
- Remote patient monitoring (RPM) platforms and telemedicine services (software-led, usually with device integrations)
- Disease-specific monitoring and diagnostics (sleep, cardiac, diabetes, respiratory - often “hardware + analytics”)
- Home medical equipment and respiratory care services (DME-like businesses with in-home setup and support)
- Consumer/wellness monitoring (wearables with varying levels of medical-grade rigor)
- Enabling infrastructure (secure device connectivity, portals, interoperability tools, sensing components)
Why valuation is different here
Three things make patient monitoring valuation “special” compared to most software or device businesses:
- Clinical credibility is a valuation input. Buyers price “proof” - clinical validation, regulatory position, and outcomes - not just growth.
- Reimbursement and workflow fit can matter as much as the product. A great device that doesn’t fit billing rules or clinical routines often trades like a science project.
- Hardware is rarely the premium - the data layer is. Many of the best outcomes in the data come from businesses that turn monitoring into a scalable, high-margin data or diagnostics engine (even before EBITDA is positive), while services-heavy or commodity distribution tends to compress multiples. (See the premium driver patterns and the DME comps.)
Key risks buyers will always pressure-test
Expect diligence to focus hard on:
- Regulatory and clinical claims (what is proven vs “directionally true”)
- Data security, privacy, and interoperability (especially when you touch PHI)
- Reimbursement exposure (what % of revenue depends on specific codes, payer behavior, or policy interpretation)
- Evidence of adoption beyond pilots (workflow stickiness, renewals, and expansion)
- Hardware supply chain and sensor accuracy (if the device is central to the clinical claim)
- Concentration risk (one channel partner, one payer, one health system can dominate outcomes)
2. What Buyers Look For in a Patient Monitoring Business
Buyers are not buying your “product.” They are buying a durable position in a care pathway.
The obvious, universal factors
These still matter a lot:
- Scale (revenue size and repeatability)
- Growth (ideally with a clear reason it will continue)
- Gross margin (what’s left after costs of delivering the service/device)
- Profitability or a believable path to it
- Customer retention (do they stick around and expand?)
The sector-specific factors that move multiples
In this sector, valuation often swings on:
- Medical-grade defensibility: clinical validation, clear differentiation, credible claims
- Where you sit in the workflow: “nice-to-have reporting” vs “must-have monitoring that triggers action”
- Recurring data revenues: analytics subscriptions, monitoring programs, portals - not just one-time hardware
- Distribution leverage: a buyer sees a path to sell your solution across an existing footprint (hospitals, DMEs, sleep clinics, payers, pharma)
- Regulatory/reimbursement readiness: aligned with RPM programs and payer incentives (a recurring theme in premium outcomes)
How private equity thinks about you
PE tends to ask:
- What multiple do we pay now vs what can we sell it for in 3-7 years? If you look like a services-heavy DME business, they assume lower exit multiples. If you look like a scalable data/diagnostics platform, they can underwrite higher exits - but only with proof.
- Who is the future buyer? Strategics (medtech, device platforms, connected care), larger PE, or occasionally public markets.
- What levers can we pull fast? Price discipline, improving gross margin, reducing services drag, tightening sales execution, add-on acquisitions, expanding channels.
If your business “reads” like a platform that can be scaled with systems and process, PE interest rises. If your business depends on founder heroics and custom deployments, they haircut valuation.
3. Deep Dive: “Are You Selling Monitoring Hardware - or a Data/Diagnostic Asset?”
This is one of the biggest valuation forks in patient monitoring. Two companies can both “sell patient monitoring,” but one will be priced like hardware and the other like a high-margin clinical data business.
How this shows up in the data
Across precedent deals, high gross margin, software/data-heavy models have achieved premium outcomes even when EBITDA is negative (examples include high-margin diagnostics/software and connectivity platforms). In contrast, home respiratory/DME-style providers can have real EBITDA but still trade at much lower revenue multiples (around ~1.1x revenue in the DME deals group). The data basically says: commodity distribution is priced like distribution, and differentiated clinical data is priced like an asset.
Why buyers care
- Hardware alone is easier to copy, price pressure is constant, and replacement cycles are slow.
- Data and diagnostics can compound: more patients monitored → better datasets → better outcomes → stickier contracts and higher pricing power.
- Platforms that improve clinical workflows (alerts, triage, portals, integrations) become “embedded,” which reduces churn.
How to move from “hardware” to “data asset” in 6-12 months
You do not need to change your product overnight. You need to change what you can prove and how your revenue behaves:
- Turn deployments into recurring programs (analytics, portals, reporting, continuous monitoring services)
- Publish credible validation and outcomes (even if it’s retrospective real-world evidence)
- Show workflow integration (EHR integrations, secure APIs, clear clinical pathways)
- Measure retention and expansion (patients per customer, monitored days, reorders, upsells)
Mini-table: lower-value vs higher-value profile
4. What Patient Monitoring Businesses Sell For - and What Public Markets Show
Here’s the core truth: multiples in this space are wide because business models are wide. Your valuation is mostly about which bucket buyers place you in, and whether your evidence supports a premium story.
4.1 Private Market Deals (Similar Acquisitions)
From the precedent transactions data, private deal revenue multiples cluster by “what the asset is”:
- DME/home respiratory providers sit around ~1.1x revenue on average/median, with EV/EBITDA around ~6.2x in the group.
- Hospital patient monitoring & care infrastructure deals are around ~2.7x revenue and ~13.5x EBITDA (group averages/medians).
- Respiratory hardware & IoT connectivity platforms are around ~3.4x revenue (group averages/medians).
- Home sleep diagnostics & digital respiratory software deals show very high revenue multiples (around ~28.0x in the group), reflecting strategic/scarcity dynamics in diagnostics and software-led assets.
A founder-friendly way to read this: services-heavy distribution businesses are valued like distribution; differentiated clinical software/diagnostics can be valued like strategic IP.
These are illustrative ranges from the provided deal groupings - not a promise of what any one business will achieve.
4.2 Public Companies
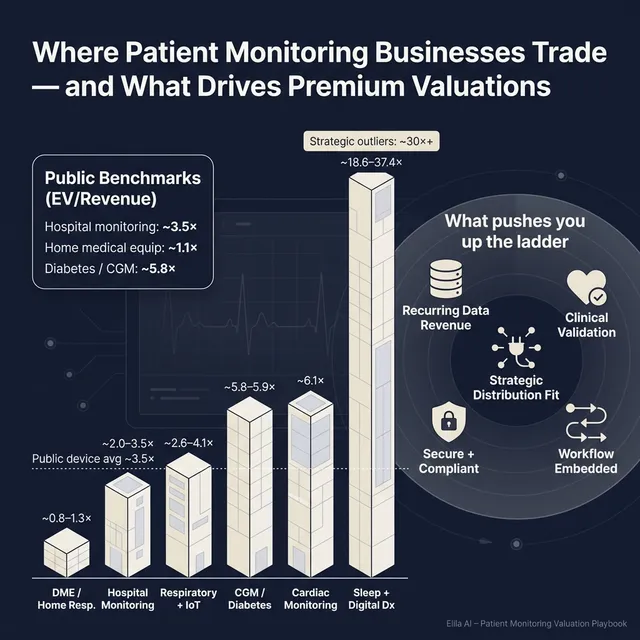
Public markets give you a “reference band,” but they can be noisy - especially for small or loss-making companies. In the public group data:
- Hospital-grade patient monitoring equipment trades around ~3.5x EV/Revenue on average (median ~3.1x), with high EV/EBITDA averages driven by profitability dispersion.
- Remote patient monitoring & telemedicine shows an extreme split: average EV/Revenue is very high (~30.1x) while the median is much lower (~3.9x). That usually means a few very expensive outliers are pulling up the average.
- Home medical equipment providers trade around ~1.1x EV/Revenue (median ~1.0x).
- Diabetes monitoring & CGM trades around ~5.8-5.9x EV/Revenue with ~22.3x EV/EBITDA.
- Cardiac monitoring services sits around ~6.1x EV/Revenue.
- Consumer/wellness wearables show lower medians (~2.5x EV/Revenue) with higher variability.
These multiples are a snapshot from the dataset and should be treated as “mid/end of 2025-like” reference points, not a live quote.
How to use public multiples correctly
- Use public comps as a ceiling and floor, not a direct price tag.
- Adjust down for smaller scale, customer concentration, weaker proof, or reimbursement risk.
- Adjust up only when you have scarcity value: validated clinical edge, defensible data, and obvious strategic fit.
5. What Drives High Valuations (Premium Valuation Drivers)
Premium outcomes in patient monitoring are rarely about “hype.” They are about credible proof + scalable economics + strategic fit.
Below are the drivers that show up in the provided deal patterns, grouped into themes - plus a few universal M&A best practices.
5.1 High-margin, scalable “data economics”
Premium deals show buyers will pay up for high gross margin, software/data-heavy models even when EBITDA is negative, especially when there’s a clear path from device deployment to recurring analytics or program revenue.
What this looks like in real life:
- Your “device” is the on-ramp to recurring monitoring programs, analytics, portals, and reporting.
- You can show gross margin expanding as you scale (because software and data scale better than services).
5.2 Clinical validation and disease-specific edge
Premium outcomes are tied to clinical validation and a clear diagnostic or disease-specific advantage, especially in large, underdiagnosed conditions (sleep and respiratory are highlighted in the precedent data).
Practical examples buyers pay for:
- Peer-reviewed or high-quality real-world evidence
- Clear performance metrics tied to outcomes (reduced time-to-diagnosis, improved adherence, fewer adverse events)
- A regulatory position that supports claims and reimbursement narratives
5.3 Alignment with the shift to home-based care and reimbursement reality
A consistent premium theme is alignment with home monitoring tailwinds and payer incentives: businesses that enable care outside the hospital, integrate into RPM programs, and show measurable longitudinal outcomes tend to be more strategically attractive.
What founders can highlight:
- Retention and engagement in monitoring programs (monitored days, adherence)
- Workflow benefits for clinicians (less manual review, better triage)
- Clear reimbursement logic and operational readiness
5.4 Strategic buyer fit and distribution synergies
Strategics pay more when your product “slots in” to an existing commercial footprint. In the data, acquisitions with clear platform extension logic and distribution leverage supported premium narratives.
How to make this real:
- Show integration readiness (APIs, EHR connectors, secure data pipelines)
- Document pilots that prove cross-sell velocity
- Map “who sells what to whom” in a buyer’s world - and where you unlock revenue faster than they could build internally
5.5 Secure connectivity and interoperability as a value layer
Connected data platforms - secure transmission, portals, and interoperability - are explicitly valued in the precedent drivers. In healthcare, “it works” is not enough; “it works safely and plugs in” matters.
Signals that help:
- Security posture (policies, audits, incident history)
- Integration track record (how long it takes to onboard a new provider)
- Data governance and privacy controls
5.6 Universal credibility builders
Even in this sector, some basics still drive premium outcomes:
- Clean financials and clear revenue recognition
- Diversified customer base and channels
- A leadership bench beyond the founder
- A repeatable go-to-market motion (not bespoke deployments every time)
6. Discount Drivers (What Lowers Multiples)
Low-end outcomes usually come from one thing: buyers see risk they can’t price confidently, so they protect themselves by lowering the multiple, demanding earn-outs, or walking away.
6.1 Being bucketed as a commodity DME/distribution business
If your story is “we deliver equipment and services,” you risk getting valued like DME/home respiratory providers (which, in the data, cluster around ~1.1x revenue in private deals and ~1.0-1.1x in public comps).
How to counter it:
- Prove proprietary value (validated metrics, unique datasets, software margin)
- Show you are not just reselling devices or providing staffing-heavy services
6.2 Weak proof behind clinical or diagnostic claims
If your claims are strong but evidence is thin, buyers treat your upside as optional - and they will not pay full price for optionality.
Fixable signals:
- Better study design, stronger documentation, clearer outcomes tracking
- A tighter regulatory story (what you can legally claim today)
6.3 Reimbursement uncertainty or fragile economics
If revenue depends on assumptions about billing, payer behavior, or one partner’s program design, buyers discount.
What helps quickly:
- Clear documentation of reimbursement pathways
- Evidence of stable collections and renewal behavior
6.4 Services-heavy delivery and “founder-dependent” operations
Customization, heavy implementation, and founder-led sales reduce confidence in scalability. Buyers worry margins won’t improve.
What to improve:
- Standardize onboarding and support
- Build a second layer of management and sales
6.5 Concentration risk and channel dependency
One big health system, one DME partner, or one payer can make revenue look stable - until it isn’t.
Mitigation:
- Add 3-5 credible new logos
- Diversify channels (provider + payer + strategic partner mix)
7. Valuation Example: A Patient Monitoring Company
This is a worked example to show the logic - not investment advice or a formal valuation.
Fictional company: “PulseBridge Monitoring”
Assume a fictional patient monitoring business with USD 10.0m of last-twelve-month (LTM) revenue:
- Hybrid model: device + cloud analytics + clinician portal
- Sells into home-based monitoring programs and some hospital outpatient clinics
- Solid early growth, but not yet consistently profitable on EBITDA
- Strong data security posture; integrations exist but not “plug-and-play everywhere” yet
Step 1: Build a base multiple range from relevant comps
A reasonable starting point is to blend the most relevant public and private reference buckets:
- Device-heavy hospital monitoring comps tend to sit in the low-to-mid single-digit revenue multiple range (public group median ~3.1x; average ~3.5x).
- Software-led RPM/public comps have a low median (~3.9x) but a much higher average (~30.1x), which suggests “some platforms get priced very high, many do not.”
- Diagnostics-adjacent categories like CGM and certain monitoring services sit around mid single-digit revenue multiples in public markets (around ~5.8-6.1x in the groups).
- Private precedent deals show low multiples for DME-like services (~1.1x) and higher multiples for differentiated software/diagnostics (sleep diagnostics group ~18.6-37.4x, but those are strategic/scarcity-style outliers).
So for a hybrid patient monitoring business at USD 10m revenue, a clean “core” anchor is often mid single-digit to high single-digit EV/Revenue when the story is truly data/clinical-led, and lower when it looks like services/distribution.
The provided sector logic example supports an illustrative 4.0-9.0x EV/Revenue band for a hybrid monitoring + analytics company at this scale, with the caveat that reaching the high end requires clearer proof and margin quality.
Step 2: Apply three scenarios (USD 10m revenue)
How those scenarios happen:
- Discounted case (around 3.0x): the business is viewed as device + services with limited proof of recurring analytics value, unclear reimbursement durability, or heavy customer concentration.
- Base case (4.0-7.0x): credible clinical utility, improving margin profile, recurring program revenue, and clear workflow fit.
- Premium (8.0-9.0x): strong clinical validation, high gross margin mix, evidence of retention and expansion, and a strategic buyer who can scale you quickly through distribution.
Step 3: What this means for you
Two patient monitoring businesses can both have USD 10m revenue and end up with wildly different outcomes. The difference is not “luck.” It’s usually:
- whether you look like an asset (data/diagnostics/workflow) vs an operator (devices/services)
- whether your proof reduces buyer fear
- whether a buyer can tell a simple synergy story to their investment committee
8. Where Your Business Might Fit (Self-Assessment Framework)
Use this as a quick, honest tool to estimate whether you are closer to discounted, base, or premium outcomes. Score each factor 0-2:
- 0 = weak / unclear
- 1 = mixed / improving
- 2 = strong / proven
How to interpret your total
- High scores: you are closer to premium narratives - buyers can underwrite your future with confidence.
- Middle scores: you can still get a strong outcome, but your process and story discipline matter a lot.
- Low scores: you are at risk of being bucketed into lower-multiple categories. The good news: many of the highest-payoff fixes are doable in 6-12 months.
9. Common Mistakes That Could Reduce Valuation
9.1 Rushing the sale
If you start a process before your numbers and story are ready, buyers drive the timeline - and the price - not you.
What “ready” looks like:
- clean monthly financials
- clear revenue breakdown (device vs software vs services)
- a simple KPI pack (retention, churn, cohort expansion, gross margin trends)
9.2 Hiding problems
In healthcare, issues always surface in diligence. If you hide something and it shows up later, buyers lose trust and protect themselves with price cuts, earn-outs, or tougher terms.
Better approach:
- disclose early, frame clearly, show a mitigation plan
9.3 Weak financial records
Messy financials are a tax on valuation. Buyers will assume the worst if they can’t see the truth.
Common quick wins:
- tighter revenue recognition (especially for bundled device + monitoring programs)
- clearer gross margin reporting by product line
- better tracking of implementation and support costs
9.4 No structured, competitive sale process with an advisor
A competitive process creates price discovery. There is research suggesting that running a structured, competitive process with an advisor can lead to meaningfully higher purchase prices - around 25% in some studies - because more buyers means more tension and better terms.
9.5 Naming your price too early
If you say “we want USD 10m,” don’t be surprised when offers cluster at USD 10.1m and USD 10.2m. You just killed the auction. Let buyers tell you what the asset is worth before you anchor it.
9.6 Industry-specific mistake: over-claiming clinical capability
If your marketing claims get ahead of your validation/regulatory position, you trigger diligence friction and legal risk concerns - and that can directly hit valuation.
10. What Patient Monitoring Founders Can Do in 6-12 Months to Increase Valuation
Think of this as three parallel workstreams: improve the numbers, reduce risk, and sharpen the story.
10.1 Improve the numbers buyers actually pay for
- Increase recurring revenue share (analytics subscriptions, monitoring programs, portal fees)
- Reduce services drag (standardize onboarding, price implementation, avoid custom one-offs)
- Show gross margin trend lines improving quarter by quarter
- Build a simple “cohort” view: do customers stick and expand over 12-24 months?
10.2 Strengthen clinical proof and reimbursement confidence
- Package your validation: what is proven, by whom, and on how many patients?
- Build outcomes reporting into the product (so you can prove value at scale)
- Document reimbursement pathways and collections behavior (buyers hate uncertainty here)
10.3 Make integration and security a selling point, not a question mark
- Tighten interoperability: APIs, EHR integrations, implementation playbooks
- Create a security “ready folder”: policies, audits, incident history, access controls
- Track onboarding time and aim to reduce it (speed = scalability)
10.4 Reduce concentration and founder dependency
- Add a handful of credible new logos to diversify risk
- Build a second line of leadership (sales, ops, product)
- Document your sales process so it’s repeatable without you
10.5 Build buyer-specific synergy stories
- Identify 30-100 likely buyers and map “why them”
- For each major buyer type (device platform, connected care, payer-adjacent), build a one-page synergy case:
- how they distribute
- what you add
- what revenue/cost uplift looks like in plain terms
11. How an AI-Native M&A Advisor Helps
Selling a patient monitoring business is hard because it sits at the intersection of healthcare proof, technology, and buyer psychology. The best outcomes usually come from running a wide, disciplined process where the right buyers compete - and where your story is framed in the language those buyers use.
Higher valuations through broader buyer reach: AI can expand the buyer universe to hundreds of qualified acquirers based on deal history, strategic fit, and financial capacity. More relevant buyers creates more competition, stronger offers, and a higher chance the deal closes because you have options if one buyer drops.
Initial offers in under 6 weeks: AI-driven buyer matching and outreach, combined with fast creation of high-quality marketing materials and diligence support, can compress timelines dramatically compared to manual-only processes - without sacrificing rigor.
Expert advisory, enhanced by AI: You still want experienced human advisors to run the process, manage negotiations, and maintain credibility with acquirers. AI makes them faster and broader: better buyer targeting, stronger materials, and tighter process control - delivering “Wall Street-grade” outcomes without traditional bulge bracket costs.
If you’d like to understand how an AI-native process can support your exit, book a demo with one of our expert M&A advisors.
Are you considering an exit?
Meet one of our M&A advisors and find out how our AI-native process can work for you.


