
The Complete Valuation Playbook for Performance Marketing Businesses
A guide to how performance marketing businesses are valued today and what drives your multiple.

If you run a performance marketing business, you are right in the middle of a big shift. Budgets are moving to measurable channels, privacy rules are changing how attribution works, and both agencies and adtech platforms are being rolled up into larger groups. That combination is creating real buyer demand - and much more scrutiny on valuations.
This playbook is built for founders and CEOs of privately held performance marketing businesses who may sell in the next 1-12 months. It is data-based, grounded in recent private deals and public trading multiples across agencies, influencer shops, and adtech platforms.
You will see what similar businesses actually sell for, what pushes your multiple up or down, a worked valuation example on USD 10m of revenue, a self-assessment framework, and a 6-12 month action plan to move your business toward the top of the range.
1. What Makes Performance Marketing Unique
Performance marketing is not just “an agency with some Google Ads people.” The way you make money, the risks you carry, and the type of buyers you attract are different from generic creative agencies or SaaS companies - and that flows directly into valuation.
Main business models in performance marketing
Most businesses in this space fall into a few buckets (some are hybrids):
- Full-service digital & performance agencies
- Paid search, paid social, programmatic, CRO, landing pages, analytics.
- Often retainer + performance fee on ad spend or results.
- Specialist SEO / content / organic growth agencies
- Organic search, digital PR, content production.
- Usually retainer-based, sometimes with project spikes.
- Influencer / creator and social-first agencies
- Creator sourcing, campaign management, TikTok/IG/YouTube strategy.
- Mix of retained “always-on” work and campaign projects.
- CRM, email, and lifecycle / retention shops
- Email, SMS, lifecycle journeys, customer data platforms.
- Often close to “owned media”, with strong measurement and high margins.
- Adtech / performance platforms
- Affiliate networks, feed management (e.g. marketplace and product feeds), retail media, bidding or analytics platforms.
- Revenue closer to SaaS or “platform take-rate” than pure services.
Each of these behaves differently in a sale process and attracts different types of buyers (holding companies, private equity, SaaS platforms, commerce platforms, etc.).
Revenue and cost structure quirks
Compared with a classic B2B SaaS business, performance marketing businesses typically show:
- Revenue mix
- Monthly retainers (often 6-12 month rolling).
- Performance fees (e.g. % of ad spend, % of sales, leads delivered).
- Project work (landing pages, migrations, audits, creative).
- Costs
- Very people-heavy: media buyers, strategists, creatives, data people.
- Some tech and tooling, but usually much lower than a SaaS product company unless you’re a true platform.
- Media spend usually passes through (you bill the client for their ad spend). Buyers focus on net revenue / gross profit, not “billings”.
- Profitability
- Well-run agencies and boutiques often sit in the 15-30% EBITDA margin range.
- Tech-led platforms can be higher, especially if they sit on commerce or retail media rails.
Unique risk factors buyers always check
Buyers will always drill into a few sector-specific risks:
- Client concentration
- What happens if the top 1-3 clients leave?
- Many agencies still have 30-50% of revenue in a handful of accounts - that drags multiples down.
- Platform dependence
- Heavy reliance on 1-2 channels (e.g. Meta + Google only).
- Exposure to privacy, iOS changes, algorithm shifts.
- Attribution fragility
- Are results robust to attribution changes, or did your numbers look great because of one tracking setup that could break?
- Founder dependency
- Are you the “closer” and the main client owner?
- Does the team run the machine when you step away?
- People and culture risk
- Can key account leads and strategists walk out and take clients with them?
- How sticky is your team in a post-deal earn-out period?
Valuation in this sector is basically a judgment on how durable and scalable your net revenue and EBITDA are, given all of those moving parts.
2. What Buyers Look For in a Performance Marketing Business
Put simply, buyers are asking: “If we pay you X today, how confident are we that your profit will grow, not shrink, over the next 3-7 years?”
The obvious filters (that still matter a lot)
Most buyers - holding companies, digital groups, PE funds, even SaaS platforms - start with:
- Scale
- Revenue and EBITDA size.
- USD 5-20m revenue is “mid-market” for agencies; bigger platforms can go well beyond that.
- Growth rate
- Are you growing 5%, 15%, or 40% a year?
- Growth makes buyers more forgiving on margins and concentration.
- Profitability
- Level and consistency of EBITDA margins.
- Deals in the data with strong margins (like Shopper Media Group, with mid-30s to high-40s EBITDA margins) support higher EBITDA and revenue multiples.
- Cash conversion
- Do you get paid quickly? Any serious bad debt issues?
- Subscription-like billing and prepayment are better than long, uncertain payment cycles.
The industry-specific lenses
Beyond the basics, performance marketing buyers ask much more targeted questions:
- Revenue quality
- How much of your revenue is recurring retainers vs one-off projects?
- What percentage is on multi-year or auto-renewing frameworks?
- What is your client churn (logos and revenue)?
- Proximity to the transaction
- Are you running brand campaigns, or are you directly tied to sales, leads, and conversion events?
- Assets that sit in the commerce and retail media plumbing attracted higher revenue multiples.
- Vertical and category depth
- Are you “a generalist digital agency” or a go-to leader in gaming, entertainment, ecommerce, B2B SaaS, etc.?
- Tech and data enablement
- Do you have proprietary tooling, data sets, or automation that meaningfully changes client outcomes or margins?
- International footprint and multi-market delivery
- Can you run global programs for enterprise clients?
- Agencies and platforms with multi-market delivery and enterprise relationships show premium valuations in the data.
How private equity thinks about your business
Private equity buyers have a very mechanical lens:
- Entry multiple vs exit multiple
- If they buy you at, say, 8x EBITDA, they need a plausible story to exit at equal or higher multiple in 3-7 years.
- EBITDA growth plan
- They plan to grow EBITDA through:
- Revenue growth (new geos, cross-sell, new verticals).
- Margin expansion (better pricing, less discounting, overhead efficiency).
- Bolt-on acquisitions (buying smaller agencies and folding them in).
- They plan to grow EBITDA through:
- Who they sell to next
- Larger PE funds, listed holding companies, or big strategic platforms.
- They ask: “Would WPP, Publicis, S4, a commerce platform, or a large adtech player buy this in 5 years?”
- Debt capacity
- Can they safely put leverage on your EBITDA without taking too much risk?
- Stable, retainer-heavy EBITDA can support more debt and therefore a higher price.
If you understand these lenses, you can shape your numbers and your story into something that feels both attractive and credible to them.
3. Deep Dive: Revenue Quality and Commerce Adjacency - The Big Valuation Divider
One of the biggest valuation swings in performance marketing is how “solid” your revenue is and how close you are to the actual transaction. Two agencies with the same top-line can sit at completely different multiples because of these two factors.
What the data shows
Looking across recent deals:
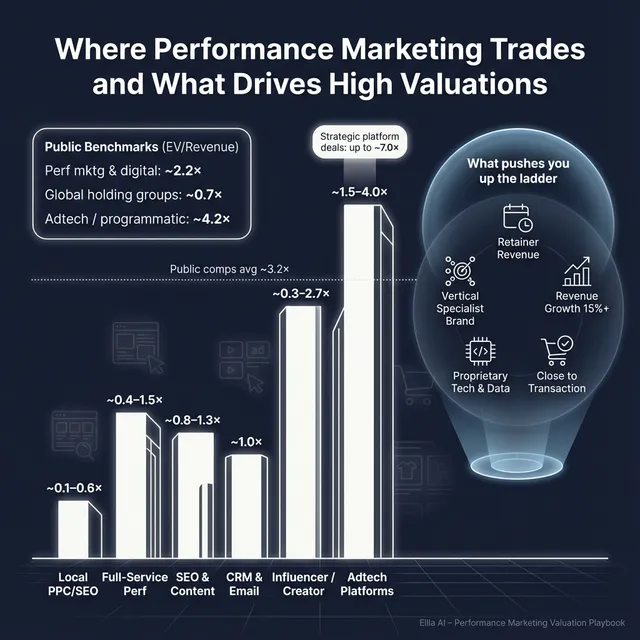
- Classic full-service performance agencies often trade around 0.4-1.3x EV/Revenue, with a cluster near 1.0x.
- Specialist SEO/content agencies sit around 0.8-1.2x revenue and roughly 8-11x EBITDA.
- Commerce-adjacent or retail media/feeds platforms sit much higher - with deals placing around 1.8x - 7.6x revenue.
- Influencer and creator agencies show a wide spread. More fragile performance or less profitability sit closer to 0.3-0.8x revenue, while at the higher end deals can close at 2.7x revenue reflecting higher retainers and repeat spend.
So the pattern is clear: buyers pay up when revenue is predictable and close to the cash register, and discount harder when it is project-heavy, volatile, or far from the transaction.
Why buyers care so much
For a buyer, revenue quality and commerce adjacency affect:
- Risk of revenue decline
- Retainer-based, multi-year contracts with high renewal rates are less risky than one-off campaigns.
- Visibility into future performance
- If you are embedded in a client’s transaction or product feed, they basically have to rip out a core system to leave you.
- Margin leverage
- Commerce and retailer-adjacent solutions often support higher margins, which buyers multiply.
- Synergies
- A large platform can push more volume through your commerce, retail media, or feed infrastructure, unlocking extra value they’re willing to pay for.
Moving from “left column” to “right column”
If your business today is mostly project-based or further up the funnel, the game is to gradually slide along this spectrum:
Practical steps over 12-24 months:
- Convert repetitive project work into retainers with defined scopes.
- Build productized services around high-value outcomes (e.g. “retail media operating unit” or “feed health and conversion package”).
- Invest in lightweight proprietary tooling (scripts, connectors, dashboards) that tie your work tighter to the client’s transaction systems.
- Push for multi-market or multi-brand mandates with your best enterprise or mid-market clients.
You don’t need to become a pure software company to move your multiple. You just need to prove that your revenue and margins are more like a “performance engine” than a collection of one-off campaigns.
4. What Performance Marketing Businesses Sell For - and What Public Markets Show
This is the part most founders want to jump straight to: “So what are companies like mine actually worth?”
The reality: there is a band, not a single number. Where you sit inside that band depends heavily on the drivers in sections 2 and 3. But the data does give some clear reference points.
4.1 Private Market Deals (Similar Acquisitions)
Looking at recent acquisitions across agencies, influencer shops, CRM/email boutiques, and adtech platforms, the overall picture is:
- Across all digital and performance marketing deals, average EV/Revenue is around 1.5x, with a median around 1.5x as well.
- For full-service digital & performance marketing agencies, the average EV/Revenue is about 1.3x, but the median is much lower (around 0.6x), showing a long tail of higher-multiple deals for premium assets.
- Average EV/EBITDA for these agencies sits around 8.1x, with a median around 6.4x.
- Adtech and marketing tech platforms show higher averages (about 2.6x revenue and very high average EBITDA multiples due to some extreme outliers), but median revenue multiples nearer 1.9x and median EBITDA near 11.9x.
Putting that into a simple table for typical ranges:
These ranges are illustrative, not a price tag. They give a sense of where “normal”, “good”, and “strategic premium” live for different kinds of performance marketing assets.
4.2 Public Companies
Public markets give another reference point, mostly for larger, scaled groups. They tend to trade at higher multiples than private deals, both because of scale and because their shares are liquid.
Across the full public dataset related to performance marketing and adtech:
- Overall average EV/Revenue is about 3.2x and average EV/EBITDA around 22.9x.
- For mid-market performance marketing agencies and digital marketing services, public comps show:
- Average EV/Revenue ~2.2x, median around 1.3x.
- Average EV/EBITDA ~19.7x, median around 9.4x.
- Global holding groups:
- Trade closer to 0.6-0.7x revenue and 5-6x EBITDA on average.
- Adtech and programmatic platforms show:
- Average EV/Revenue ~4.2x, but median only 0.8x, reflecting a few high-multiple outliers.
- Average EV/EBITDA ~37.0x, median around 6.9x.
- Regional/vertical digital marketing & media players average about 2.5x revenue and 18.6x EBITDA (medians closer to 0.9x and 9.2x).
You can summarize it like this (public markets snapshot around mid-2025):
How to use public multiples as a founder
Think of public multiples as bookends and direction, not a direct answer:
- Upper band for best-in-class assets:
- If you are a scaled, high-growth, tech-enabled platform deeply embedded in commerce or retail media, you might argue for revenue multiples approaching certain public adtech peers - but usually with a private-company discount.
- Core band for agencies and service-led businesses:
- For most mid-market performance agencies, a 0.6-1.5x revenue and 6-10x EBITDA band is where many real deals land.
- Public comps for similar businesses tend to be higher, but private deals apply a discount for size, liquidity, and risk.
- Outliers and anomalies:
- Very high multiples (e.g. 7x+ revenue, 50x+ EBITDA) are typically tied to very strategic acquisitions with clear synergies, or special situations. They are not realistic anchors for most mid-market sellers.
5. What Drives High Valuations (Premium Valuation Drivers)
Now that you’ve seen the ranges, the key question is: how do you move from the bottom to the top of that band?
The data across deals and publics, plus broader M&A experience, shows clear “themes” that pull multiples up.
a) Deep category and vertical specialization
Premium deals often involve specialists with enterprise workflows, not generalists.
Why buyers pay more:
- You are harder to replace (few real substitutes).
- You are deeply embedded in client strategy and planning.
- Your team and brand carry credibility in that vertical.
Practical moves:
- Pick 1-2 verticals where you already have wins and double down.
- Build sector-specific playbooks, benchmarks, and case studies.
- Shift positioning from “we run your ads” to “we are the go-to growth partner for X industry.”
b) Commerce and retail media adjacency with strong margins
Assets that sit right on the transaction and product feed command better multiples.
Why buyers pay more:
- You see the transaction data and can prove incremental revenue impact.
- You are integrated with marketplaces, feeds, and retailer networks.
- Margins are structurally higher because you are closer to “infrastructure” than “services”.
Practical moves:
- Productize feed management, retail media operations, marketplace launch services.
- Build connectors and scripts into major platforms (Amazon, Meta, Google, TikTok, big retailers).
- Track and show your “incremental sales” and “retail media ROI” as core KPIs.
c) Tech-enabled and data-rich performance engines
Tech-led players clearly sit at the higher end of the valuation range.
Why buyers pay more:
- Proprietary tech increases switching costs for clients.
- Automation improves margins and scalability.
- Buyers can roll your tech out across their wider customer base.
Practical moves (you do not need a full SaaS product):
- Build and brand internal tools - scripts, optimization engines, reporting platforms.
- Capture and warehouse your cross-client performance data in a way that is reusable and defensible.
- Make your tech a visible “pillar” of your pitch and your data room.
d) Influencer and creator engines with retainers and EBITDA
Influencer agencies can be either fragile or highly valuable.
Why buyers pay more:
- Big brands are moving large budgets into creator and social-first work.
- Once processes, creator relationships, and measurement are in place, retainers and repeat campaigns become very sticky.
Practical moves:
- Turn “one-off influencer campaigns” into always-on creator programs.
- Standardize measurement (brand lift, sales, ROAS) to show clear impact.
- Build proprietary creator networks and CRM-style internal tools around them.
e) Long operating history, resilient margins, and board-level trust
Older, proven firms with stable margins and deep C-suite relationships get rewarded.
Why buyers pay more:
- They are buying a trusted brand and relationship network, not just a P&L.
- There is evidence you can survive cycles and change in platforms.
Practical moves:
- Invest in thought leadership and board-level relationships in your chosen verticals.
- Show multi-year client tenure and long-term strategic engagements.
- Keep EBITDA margins stable through cycles, even if growth slows slightly in a given year.
f) Strong fundamentals and clean execution
Finally, the “boring” stuff still moves your multiple:
- Clean, audited quality financials, clear split of media pass-through vs net revenue.
- Consistent EBITDA margins in the mid-teens or higher.
- Healthy client diversification (no single client over 20% of revenue ideally).
- A capable second-tier leadership team beyond the founders.
These are rarely the headline in a press release, but they are often what moves you from, say, 0.7x to 1.1x revenue, or from 6x to 9x EBITDA in a real negotiation.
6. Discount Drivers (What Lowers Multiples)
Just as there are patterns behind high multiples, there are consistent reasons why some performance marketing businesses transact at the bottom of the range - or fail to sell at all.
Common discount and red-flag drivers
- Project-heavy, unpredictable revenue
- If most of your revenue is one-off projects or short campaigns without clear renewal patterns, buyers assume higher churn and lower certainty - giving you a 0.1-0.5x revenue type profile similar to small regional boutiques.
- Weak or negative profitability
- Low single-digit or negative EBITDA, especially over multiple years, signals potential structural issues (pricing, cost base, service mix).
- Some deals like AutoWeb (adtech with negative EBITDA) traded at extremely low revenue multiples (~0.1x).
- High client concentration
- When 30-50% of revenue depends on a single client or two, buyers assume they are “buying a key account” rather than a business.
- This caps both revenue and EBITDA multiples, and often leads to heavy earn-out structures.
- Over-reliance on one channel or platform
- If 80%+ of spend and expertise sits in a single platform (Google, Meta, TikTok), you are exposed to algorithm and policy changes.
- Buyers price in the risk of sudden performance deterioration.
- No tech, no data, no real moat
- Pure “body shops” that simply rent out media buyers, with no meaningful IP, get treated like staff agencies.
- This often pushes valuations toward lower EV/Revenue and mid-single-digit EBITDA multiples.
- Founder-dependency
- If the founder personally owns all major client relationships and the brand, buyers worry about what happens after the earn-out.
- This leads to lower upfront price, more contingent payments, and sometimes scares buyers off completely.
- Messy financials and unclear net revenue
- If your P&L mixes media pass-through with fees, or you can’t clearly show gross margin and EBITDA by service line, buyers will assume the worst.
- At best, they’ll widen their discount “just in case”; at worst, they’ll walk.
- Weak alignment with buyers’ strategic roadmap
- Businesses outside buyers’ focus verticals or geographies, or with little synergy potential, often trade at a visible discount even if they are “good” on paper.
The point is not to scare you, but to help you spot where your business might be leaking value - and where 6-12 months of targeted work can have a real payoff.
7. Valuation Example: A Performance Marketing Company
To make this concrete, let’s walk through a fictional valuation example using USD 10m of annual revenue.
We’ll call the company “AtlasPerformance”.
Important: AtlasPerformance is fictional, and the valuation ranges below are illustrative, not investment advice or a formal fairness opinion.
7.1 The setup - what kind of business is this?
- Services-led performance marketing agency (not SaaS).
- Revenue: USD 10m (net revenue / fees, not including client media spend).
- EBITDA margin: around 10% (USD 1m EBITDA).
- Client base:
- Mix of mid-market ecommerce and B2B clients, mostly in 2-3 verticals.
- Top client is 18% of revenue; top 5 are 55%.
- Revenue mix:
- 65% retainers (6-12 month contracts).
- 35% projects and campaigns.
- Tech and data:
- Some internal scripts and reporting dashboards, but no fully productized platform.
- Geography:
- Mostly one region (e.g. Europe or North America) with some cross-border work.
This is similar in spirit to many mid-market performance agencies in the data, and roughly in line with the detailed “Ad Agents” logic in the sources.
7.2 Step 1 - Using market data to choose a core multiple range
We start by looking at comparable segments:
- Private full-service digital & performance agencies:
- EV/Revenue averages around 1.3x, medians around 0.6x.
- EV/EBITDA averages around 8.1x, medians around 6.4x.
- Public mid-market performance marketing and digital services:
- Average EV/Revenue ~2.2x, median around 1.3x.
- Average EV/EBITDA ~19.7x, median around 9.4x.
For a mid-sized, services-led, non-SaaS business like AtlasPerformance, it is reasonable to:
- Apply a private company discount vs the public trading multiples.
- Focus on the services agency ranges, not the adtech/platform outliers.
A sensible core EV/Revenue band for this profile, based on the data, is roughly:
0.6x - 1.2x EV/Revenue
Cross-check with EBITDA:
- EBITDA = USD 1m (10% of 10m).
- If we apply 6-10x EBITDA, which matches many real agency deals, we get:
- Low end: 6x * 1m = USD 6m EV.
- High end: 10x * 1m = USD 10m EV.
On revenue:
- 0.6x * 10m = USD 6m EV.
- 1.2x * 10m = USD 12m EV.
So EBITDA and revenue approaches roughly align, pointing to USD 6-12m as a core valuation band for a typical business like this.
7.3 Step 2 - Adjusting for premium and discount factors
Now we adjust within that band using the premium/discount drivers.
Base case - “fair” asset (Atlas as described above)
- Good but not amazing growth, decent margins, some specialisation, but limited proprietary tech and mostly single-region.
- A buyer might anchor around:
- 0.8-1.0x revenue, or
- 7-9x EBITDA.
On USD 10m revenue and USD 1m EBITDA:
- EV: roughly USD 8-10m.
Premium scenario - if Atlas leans into the drivers
Imagine AtlasPerformance:
- Pushes EBIDTA margin to 18-20% through better pricing and scope control.
- Grows revenue to USD 12m while maintaining that margin.
- Shifts more work into retainers, retail media, and feed/commerce-related services.
- Invests in a properly branded internal platform and multi-market delivery, adding some proprietary IP and deeper enterprise relationships.
Now a buyer could see AtlasPerformance as bordering on the “specialist + tech-enabled + commerce-adjacent” bucket:
- Revenue multiples could plausibly move toward 1.2-1.8x, depending on buyer fit.
- EBITDA multiples might move into the 9-12x zone.
On the original USD 10m revenue for comparison:
- 1.5x revenue (mid of 1.2-1.8x) → USD 15m EV.
- If EBITDA is 2m at that point, 10x EBITDA = USD 20m.
(Again, this is illustrative. The real outcome would depend on the actual numbers at the time of sale.)
Discounted scenario - if key weaknesses exist
If AtlasPerformance had:
- Only 5-7% EBITDA margin.
- Very high client concentration (40%+ in one client).
- Heavy project reliance and weak retention.
- Little vertical focus or tech.
Then buyers might push the multiple down to:
- 0.3-0.5x revenue, or
- 4-6x EBITDA (if EBITDA is positive).
On USD 10m revenue and, say, USD 0.5m EBITDA:
- 0.4x revenue → USD 4m EV.
- 5x EBITDA → USD 2.5m EV.
Buyers would then negotiate around that lower band, possibly with significant earn-out tied to fixing those issues.
7.4 What this means for you
Two performance marketing businesses with the same USD 10m revenue can realistically be worth:
- USD 4-6m if heavily discounted.
- USD 6-12m in a “normal” mid-market agency profile.
- USD 15-20m or more if they combine:
- Retainer-heavy, sticky revenue.
- Strong EBITDA margins.
- Vertical depth.
- Commerce adjacency and/or proprietary tech.
- Strategic fit with the buyer.
Your job over the next 6-12 months is not to argue for a fantasy multiple, but to earn your way up that band with concrete improvements in the drivers.
8. Where Your Business Might Fit (Self-Assessment Framework)
Here’s a simple way to locate yourself on the valuation spectrum using the themes we’ve talked about.
How to use this
- For each factor group, score yourself 0, 1, or 2:
- 0 = weak / risky
- 1 = okay / mixed
- 2 = strong / best-in-class
- Be brutally honest. This is for you, not for a pitch deck.
Interpreting your total score
You’ll end up with a score between 0 and 10 if you use one entry per group, or higher if you add more rows on your own. As a rough guide:
- Top band (8-10+) - “Premium-ready”
- You likely sit toward the upper end of the private agency ranges:
- Perhaps 1.0-1.5x revenue and 8-12x EBITDA, higher if you have strong tech/commerce adjacency and strategic buyers.
- You likely sit toward the upper end of the private agency ranges:
- Middle band (4-7) - “Fair but improvable”
- You are probably in the core market range:
- Around 0.6-1.0x revenue and 6-9x EBITDA.
- Focused work on 2-3 high-impact factors could move you up.
- You are probably in the core market range:
- Lower band (0-3) - “Work before exit”
- You may face offers around 0.1-0.5x revenue, heavy earn-outs, or limited buyer interest.
- If you have time, it may be better to fix fundamentals for 12-24 months before selling.
The goal is not to “game the score”, but to see clearly where changes will have the biggest valuation payoff.
9. Common Mistakes That Could Reduce Valuation
There are a few avoidable mistakes that regularly cost founders real money at exit.
The big ones
- Rushing the sale
- Going to market without clean numbers, clear positioning, or preparation leads to surprises in diligence and weak buyer confidence - which translates into lower offers or failed deals.
- Hiding problems
- Every business has weaknesses. If you try to hide churn, client issues, or platform risks, they will surface in diligence.
- When they do, buyers feel misled and either walk or reprice the deal sharply downwards.
- Weak financial records
- Mixing media spend with fees, no clear net revenue view, inconsistent margins, or poor bookkeeping all hurt.
- Many margin improvements (pricing, resource allocation, dropping bad-fit clients) can be tackled in 6-12 months and show in the numbers at exit.
- No structured, competitive sale process
- Going to “one friendly buyer” without a plan almost always reduces price. Research across M&A markets shows that running a structured, competitive process with an advisor typically lifts purchase prices meaningfully (often on the order of around 25% vs one-off processes).
- Revealing the price you want too early
- If you say, “We’re looking for USD 10m,” buyers will anchor around that and respond with USD 10.1m / 10.2m offers if they can.
- You lose true price discovery. A competitive process where buyers bid without seeing your “target” often surfaces significantly higher valuations.
Industry-specific pitfalls
- Underpricing retainers and locking them in right before sale
- Discounting heavily to “pump” short-term revenue, or signing long contracts at too-low price, helps the current P&L but hurts your multiple when buyers see you’ve left pricing power on the table.
- Overselling “secret sauce” without evidence
- Claiming a unique algorithm or growth engine without data to back it up damages credibility.
- Buyers pay for measured uplift and case studies, not slogans.
Avoiding these mistakes won’t magically double your multiple, but it can easily be the difference between a good, clean exit and a painful, dragged-out process with a disappointing price.
10. What Performance Marketing Founders Can Do in 6-12 Months to Increase Valuation
You can’t turn a services agency into a SaaS platform in a year, and you don’t need to. But you can meaningfully shift how buyers see your business in 6-12 months.
Think in three buckets: the numbers, the narrative, and the risk profile.
1) Improve the numbers (without crazy pivots)
- Lift EBITDA margins by 3-5 percentage points
- Tighten scope on weak retainers; reprice underpriced clients.
- Focus headcount on high-margin services and say no to low-margin custom work.
- Even moving from 10% to 15% EBITDA can justify a higher EBITDA multiple and a higher absolute price.
- Increase recurring revenue share
- Convert repetitive projects into retainers or annual scopes.
- Offer “always-on performance” or “creator-as-a-service” packages instead of one-offs.
- Show a rising percentage of revenue coming from renewing contracts, not new projects.
- Clean up client concentration
- Gradually reduce dependence on any one client by growing others faster.
- If one client is 35% of revenue, aim to bring that below 20-25% before going to market.
2) Improve the narrative (with proof, not hype)
- Double down on 1-2 verticals
- Build sector-specific content, case studies, and benchmark reports.
- Position yourself as “the best performance partner for X vertical,” not “a generalist digital agency.”
- Show proximity to the transaction
- Track and present your impact in revenue, ROAS, cost per acquisition, CLV uplift, not just clicks or impressions.
- If you do retail media or marketplace work, show how you impact actual sales and basket size.
- Package your tech and data story
- Give your internal tools, scripts, and dashboards a name and a story.
- Show how they create better performance or margin vs a generic agency.
3) Reduce perceived risk
- Spread relationships beyond the founder
- Introduce senior team members to key clients; give them visible ownership.
- Build a clear org chart that doesn’t have the founder’s name on every key function.
- Strengthen contracts
- Move informal arrangements into signed agreements with:
- Clear scopes.
- Fees.
- Notice periods or minimum terms.
- Move informal arrangements into signed agreements with:
- Clean financials
- Separate billings (including ad spend) from net revenue / fees.
- Ensure you can show gross margin and EBITDA cleanly for the last 2-3 years.
- Fix obvious accounting issues before you go to market.
4) Prepare for a professional process
- Build a light but solid “pre-data room”
- Financials, client concentration and churn, top-20 client summaries, org chart, legal docs.
- Map your likely buyer universe
- Agencies/holding companies, PE-backed groups, commerce and adtech platforms, regional consolidators.
- Talk to advisors early
- Even 6-12 months before a planned sale, a good advisor can point you to the biggest “multiple movers” for your specific profile.
Each of these steps is realistic in 6-12 months and directly tied to the premium and discount drivers you saw earlier.
11. How an AI-Native M&A Advisory Helps
Running a sale process while you’re still running campaigns, managing teams, and chasing targets is hard. An AI-native M&A advisor like Eilla AI combines expert humans with smart technology to make that process faster, broader, and more effective.
1) Higher valuations through broader buyer reach
AI can scan thousands of potential acquirers and investors, not just the handful people remember from memory:
- It can identify hundreds of qualified buyers based on past deal history, strategic fit, financial capacity, and clear synergies (for example, a commerce platform missing a performance capability, or a PE fund rolling up agencies in your vertical).
- More relevant buyers means more real competition, not just more emails.
- If one buyer drops during diligence, you still have alternatives in play - which protects both price and deal certainty.
2) Initial offers in under 6 weeks
A lot of time in traditional processes is lost to manual work:
- AI can help assemble marketing materials, financial summaries, and buyer outreach lists much faster.
- Matching and connecting with relevant buyers, plus supporting the heavy lifting in early diligence, can pull initial conversations and offers forward significantly.
- The outcome: serious buyers at the table in weeks rather than many months, without sacrificing quality.
3) Expert advisory, enhanced by AI
This is not “bots doing deals.” It is experienced M&A advisors using AI as leverage:
- Senior professionals with decades of deal experience guide strategy, positioning, negotiation, and process design.
- AI helps them prepare Wall Street-grade materials, with clear numbers and a sharp, strategic narrative that speaks the buyer’s language.
- You get the quality and credibility of an institutional advisor without the traditional bulge-bracket overhead and fee structure.
If you’d like to understand how an AI-native, performance-marketing-savvy process could support your exit - from mapping your valuation range to running a competitive global process - you can book a demo with one of Eilla AI’s expert M&A advisors and explore whether it’s the right fit for your goals and timing.
Are you considering an exit?
Meet one of our M&A advisors and find out how our AI-native process can work for you.


