
The Complete Valuation Playbook for Pest Control Businesses
A data-backed valuation guide for pest control companies.

If you are a pest control founder thinking about a sale in the next 1-12 months, valuation is not just a “multiple” - it is a story buyers believe, backed by numbers they trust.
This playbook is built specifically for pest control field-services businesses. It shows what similar businesses have sold for, what public markets imply, what drives premium outcomes, what drags valuations down, and how to improve your position in 6-12 months.
Nothing here is a formal valuation or investment advice. It is a practical, data-anchored guide to help you prepare for the real conversations buyers will have about your business.
1. What Makes Pest Control Unique
Pest control is a service business, but it is not “just another home services” category. Buyers value it based on a mix of recurring contracts, route economics, trust, and risk management.
Main business types you see in pest control:
- Residential route-based recurring service (monthly/bi-monthly/quarterly plans, renewals, add-ons)
- Commercial and institutional contracts (restaurants, hospitality, healthcare, food processing, multi-site retail, government)
- Termite-centric models (inspection + treatment + annual “bond” renewals, sometimes tied to repair or home improvement work)
- Specialty niches (bed bugs, fumigation, wildlife, mosquito, rodent-heavy, environmental sanitation, disinfection)
Unique valuation considerations (what makes this sector “different”):
- Recurring revenue quality matters more than headline recurring %. A “renewal” that cancels easily is not valued like a contract that is operationally sticky.
- Route density is the hidden engine of profit. Two companies with the same revenue can have very different margins depending on technician travel time, stop density, and scheduling efficiency.
- Trust and compliance are real assets. In regulated environments (food, healthcare, public sector), documented processes and audit readiness can be worth more than growth alone.
Key risks buyers will always check in pest control:
- Customer churn and plan durability (especially residential plans that are easy to cancel)
- Dependence on the owner (sales, key accounts, technician management, pricing decisions)
- Labor constraints and technician retention (hiring, training, safety, turnover)
- Insurance, claims history, and safety record (vehicle incidents, chemical handling, worker injuries)
- Regulatory compliance and licensing (including record-keeping quality and renewals)
- Customer concentration (one big commercial account can cut both ways)
2. What Buyers Look For in a Pest Control Business
Buyers are paying for future cash flow they can trust. In pest control, that trust comes from predictability, route economics, and “proof” that the revenue sticks.
The obvious fundamentals still matter:
- Revenue size and growth
- EBITDA (profit) and profit stability
- Clean financial records and predictable reporting
- A repeatable sales engine that is not just the owner
But pest-control-specific factors often decide where you land in the range:
- Contracted vs transactional mix: recurring plans and multi-year commercial contracts generally beat one-time jobs.
- Customer type mix: commercial and institutional accounts can be stickier and less price-sensitive than pure residential, if the service delivery is strong.
- Pricing power: can you raise prices annually without losing customers?
- Operational metrics: route density, stops per tech per day, first-time fix rates, retreatment rates, service callbacks.
- Branchability: can the business expand into adjacent territories without breaking delivery quality?
How private equity thinks about your pest control business
Private equity (PE) usually asks three questions:
- What multiple am I paying today, and what multiple can I sell at in 3-7 years? They want confidence they can exit to a larger buyer (a bigger pest platform, a larger PE fund, or sometimes public markets).
- What levers can I pull? In pest control, the common PE playbook levers are simple:
- Price increases and better “good-better-best” packaging
- Route optimization and technician productivity
- Add-on acquisitions (tuck-ins) to increase density and reduce overhead per branch
- Improving commercial mix and institutional penetration
- Reducing churn through better service cadence and customer communication
- Is the business resilient in a downturn? Pest control is often considered relatively resilient, but the buyer will still test whether your demand is “need-to-have” (compliance, health, safety, food) or more discretionary.
3. Deep Dive: Recurring Revenue Quality and Route Density
Many founders assume “more recurring revenue = higher valuation.” In pest control, buyers go one layer deeper: how durable is that recurring revenue, and how efficiently do you deliver it?
A residential plan that can be canceled in 30 seconds online is not valued like a commercial contract tied to audits, inspections, and documented compliance. And even a great revenue base can disappoint if your routes are inefficient.
How this shows up in deal outcomes (what the data suggests):
- Smaller, route-based field-services businesses tend to price off revenue multiples that reflect “steady, not hyper-scalable” economics.
- Buyers pay more when the service scope is more compliance-heavy or safety-critical, and when customer relationships look less churn-prone (for example, institutional end-markets). These patterns show up repeatedly in deal commentary across adjacent environmental and hygiene services.
Why buyers care:
- Revenue durability reduces buyer risk. Lower risk usually means a higher multiple.
- Route density increases EBITDA margin without needing revenue growth. That is extremely valuable because it lifts cash flow quickly.
- Predictable delivery reduces operational surprises after closing (technician turnover, service quality issues, callback spikes).
How to move from “lower value” to “higher value” in 6-12 months:
If you only take one action from this playbook: measure route density and churn monthly, and tie management incentives to improving them. Buyers love metrics that prove improvement is real.
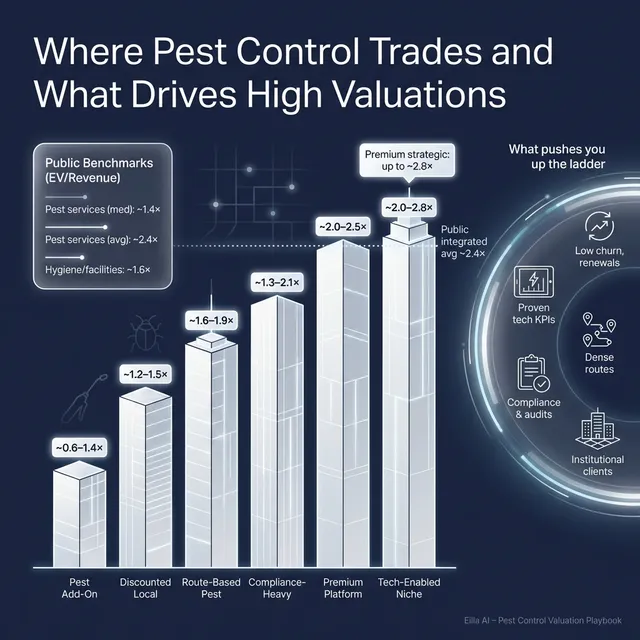
4. What Pest Control Businesses Sell For - and What Public Markets Show
Here is the cleanest way to interpret the market: public markets set reference bands, while private deals show what buyers actually pay for businesses like yours (smaller, less diversified, more owner-dependent).
The most important takeaway: pest control multiples can look “all over the place” across public companies because some are scaled pure-plays, while others have pest as a small add-on inside broader facilities or hygiene services. You want to compare yourself to the right bucket.
4.1 Private Market Deals (Similar Acquisitions)
Across the private market data, route-based pest control and adjacent environmental sanitation services tend to cluster around mid-1x to low-2x revenue for smaller operators, with variation based on profitability, contract quality, and perceived resilience.
One practical anchor from the provided deal-based framework is a “closest comp bucket” for pest control and hygiene field-services at roughly 1.6x-1.9x EV/Revenue, with modest upside for unusually strong positioning.
A simple way to think about it: if you are a solid, well-run local or regional operator without a special “moat,” buyers usually value you like a dependable cash-flow service business - not like a tech company.
Illustrative private market ranges (founder-friendly buckets):
These ranges are illustrative. Real outcomes depend heavily on your churn, margin, customer mix, and how competitive your sale process is.
4.2 Public Companies
Public market multiples (as of mid-to-late 2025) show a wide spread because “pest-related” companies are not all the same thing.
If you isolate integrated pest control services (residential + commercial), the public group shows roughly:
- EV/Revenue: around 1.4x median and ~2.4x average
- EV/EBITDA: around ~25.6x median and ~74.4x average (the average is skewed by outliers)
Other pest-adjacent public groups trade very differently:
- Environmental hygiene and facilities services with pest: typically low revenue multiples (often well under 1.0x) and mid-single to low-double-digit EBITDA multiples.
- Consumer pest control / agrochemical product businesses: the group shows low-to-moderate revenue multiples on median, with EBITDA multiples that are often mid-single digits.
- Specialized rodent biotech/tech: revenue multiples can be higher, but profitability is often negative, so EBITDA multiples are less meaningful.
Public multiples as reference bands (grouped):
*That segment’s average is heavily skewed by outliers - the median EV/Revenue in the same group is far lower, which is why founders should not treat the average as “typical.”
How to use public multiples correctly:
- Treat them as context, not a price tag.
- Adjust downward for smaller scale, higher owner dependence, and less diversification.
- Adjust upward only when you can credibly show you have “scaled-like” characteristics: durable contracts, institutional customers, predictable margins, and repeatable operations.
5. What Drives High Valuations (Premium Valuation Drivers)
Premium outcomes in pest control are rarely magic. They usually come from reducing buyer risk and proving the business can grow without breaking.
Below are the most consistent premium drivers, combining patterns from the deal data and what experienced buyers underwrite in pest control.
5.1 Compliance-heavy or safety-critical scope
Buyers pay more when demand is non-discretionary. In pest control, the premium version is often work tied to regulation, audits, or safety.
Practical examples:
- Serving regulated customer environments (food handling, healthcare, pharma, government)
- Offering documented monitoring, reporting, and audit support
- Adding adjacent compliance services (for example, environmental hygiene programs) where you can prove renewals and contract duration
5.2 Institutional and multi-site end markets
Large, institutional customers often mean longer relationships and less “shopping around” each year - if you deliver consistently.
Practical examples:
- Multi-site retail and restaurants with standardized service requirements
- Property management groups
- Facilities management partners (as long as pricing is not crushed)
- Government or public administration contracts
5.3 Credible, repeatable EBITDA strength
Premium margins get attention when they are structural, not temporary. In field services, buyers love margin strength driven by route density and operational discipline.
Practical examples:
- Higher stops per technician per day
- Lower retreatment and callback rates
- Strong technician retention and training cadence
- Consistent gross margin by service line (not just blended)
5.4 Platform characteristics: footprint and integration readiness
Even if you are not “big,” buyers pay more when your business looks like it can be built into something bigger.
Practical examples:
- Operating in multiple adjacent regions with a repeatable launch playbook
- Standard operating procedures that make tuck-in acquisitions easier
- A leadership bench beyond the owner (ops lead, sales lead, finance lead)
5.5 Technology that proves productivity (not buzzwords)
In labor-heavy services, “tech” only matters when it is measurable.
Practical examples:
- Dispatch and routing that reduces drive time
- Digital service documentation that reduces disputes and callbacks
- Monitoring-driven preventive service for commercial accounts
- Real KPIs that show productivity improvement over time
5.6 Underwritable growth (often supported by earn-outs)
Many buyers structure deals with earn-outs or deferred payments when they believe growth is real but want proof. If your future performance is measurable and credible, you can negotiate a better overall outcome.
Practical examples:
- Clear renewal pipeline and re-service cadence
- Forward booked commercial work
- A consistent lead flow engine with trackable conversion rates
6. Discount Drivers (What Lowers Multiples)
Discounts happen when buyers see risk, uncertainty, or “work they will have to do” after closing.
Common pest-control-specific discount drivers:
- High churn or weak renewal discipline (especially residential plans that cancel after the first year)
- Owner dependence (you are the sales engine, the ops engine, and the relationship holder)
- Unclear service line profitability (you do not know which services make money)
- Low route density and poor scheduling efficiency (margin is fragile)
- Technician turnover and inconsistent service quality
- Customer concentration (one or two commercial accounts make up too much of revenue)
- Pricing that has not been tested (no annual increases, or heavy discounting to win work)
- Compliance gaps (licensing, record-keeping, safety documentation, claims history)
General M&A discount drivers that show up in this sector too:
- Messy financials, aggressive add-backs, or unclear owner expenses
- Working capital surprises (buyers hate unpleasant cash-flow mechanics)
- Unresolved legal or insurance issues
- A pipeline that is “in your head” rather than tracked
The good news: many of these can be improved in 6-12 months with focused execution.
7. Valuation Example: A Pest Control Company
This is a worked example to show how valuation logic works in practice.
The company below is fictional, and the USD 10m revenue figure is fictional. The multiples are illustrative and based on the provided private market anchoring for pest control and hygiene field-services.
Step 1: The plain-English logic
- Start with the closest private market reality. For a route-based pest control field-services business, a reasonable anchor is roughly 1.6x-1.9x EV/Revenue.
- Use public comps as context, not a direct label. Large, scaled public pest control leaders can trade much higher on revenue, but they have scale, diversification, and proven margins. A small private operator usually should not expect that band.
- Adjust up or down based on premium and discount drivers. Premium characteristics can push you above the base range. Weaknesses can push you below it.
Step 2: Apply it to a fictional company
Meet HarborShield Pest Services (fictional):
- USD 10.0m revenue
- Mix: 55% residential recurring, 45% commercial (including some regulated accounts)
- EBITDA margin: 18%
- Good route density in core territory, expanding into one adjacent city
- Owner is still important, but there is an ops manager and dispatcher
Illustrative valuation scenarios (on USD 10m revenue):
What would justify the premium case?
- Strong retention data and low churn
- Institutional and regulated commercial mix with documented contract duration
- Proven route density and technician productivity metrics
- A clear, transferable management structure
- Underwritable growth (a buyer can believe it, and measure it)
What pulls you into the discounted case?
- High churn and weak renewals
- Owner dependence with no bench
- Low route density and fragile margins
- Customer concentration or a few “risk accounts”
- Messy financials or unclear service economics
Step 3: What this means for you
Two pest control companies with the same USD 10m revenue can be worth very different amounts because buyers are not paying for revenue - they are paying for durable, efficient, transferable cash flow.
If you are 6-12 months from a sale, your goal is not to “argue a higher multiple.” Your goal is to become the kind of business that earns one.
8. Where Your Business Might Fit (Self-Assessment Framework)
Use this to get an honest sense of where buyers are likely to place you in the valuation spectrum.
Score each factor 0, 1, or 2:
- 0 = weak or unclear
- 1 = okay, improving, or partially proven
- 2 = strong and documented
How to interpret your total score:
- High band: You look more “platform-like” and closer to premium outcomes.
- Mid band: You are in fair-market territory - a good process matters a lot.
- Low band: You can still sell, but you will likely face discounts unless you fix a few core issues.
The point is not to judge yourself. The point is to identify the 2-3 fixes that have the biggest valuation payoff.
9. Common Mistakes That Could Reduce Valuation
These are avoidable, and they show up constantly in service business sales.
9.1 Rushing the sale
If you start the sale process before your numbers and narrative are ready, buyers will find the gaps and price them in. A rushed sale also reduces competition, and competition is what lifts outcomes.
9.2 Hiding problems
Issues will surface in diligence. If a buyer finds something you “forgot” to mention, trust drops fast - and so does price. The better approach is to disclose clearly, explain root cause, and show the fix in progress.
9.3 Weak financial records
In pest control, buyers want to see:
- Clean revenue reporting (recurring vs one-time)
- Service line profitability (termite vs general vs mosquito, etc.)
- Technician costs and route economics
- Owner add-backs that are credible and documented
If your financials do not tell that story cleanly, buyers assume risk and discount you.
9.4 Not running a structured, competitive process with an advisor
A single-buyer negotiation is rarely where you get your best price. Research and market experience often show that a structured, competitive process with an advisor can lead to meaningfully higher purchase prices - around 25% in many cases - because it creates real price discovery and leverage.
9.5 Revealing your price too early
If you tell buyers you “want USD 10m,” you just anchored the negotiation. Instead of offering what they truly think it is worth, they will cluster offers around your number (USD 10.1m, USD 10.2m) and you lose the upside of competition.
9.6 Pest-control-specific mistake: ignoring churn and route metrics until the last minute
Founders often track revenue and “busy-ness” but not the operational drivers buyers care about. If you cannot show churn, route density, and productivity trends, you will not get full credit for your quality.
10. What Pest Control Founders Can Do in 6-12 Months to Increase Valuation
You do not need a massive reinvention. You need focused improvements that reduce buyer risk and prove durability.
10.1 Improve the numbers buyers actually pay for
- Track and reduce churn: segment it (residential vs commercial, plan type, branch).
- Increase route density: tighten territories, adjust scheduling, reduce drive time.
- Raise prices deliberately: small, systematic increases beat occasional big jumps.
- Clean up service line profitability: know which services drive margin and which dilute it.
- Stabilize EBITDA: buyers pay for repeatability, not one strong quarter.
10.2 Improve the quality of revenue
- Move one-time customers into recurring plans with clear renewal steps.
- Strengthen commercial contracts where possible (longer terms, clearer SLAs, documented compliance).
- Build “stickiness” through reporting, audit support, and proactive service cadence.
10.3 Reduce owner dependence
- Put a real ops leader in place (even if you hire or promote internally).
- Document your playbook: pricing rules, service standards, dispatch rules, escalation paths.
- Build an account management rhythm for key commercial clients that is not founder-led.
10.4 Make your story easy to believe (and easy to diligence)
- Produce monthly dashboards: churn, route density, stops per tech/day, callbacks, pricing actions.
- Organize licensing, training, and safety documentation in one place.
- Prepare a simple “why we win” narrative tied to measurable proof, not vibes.
10.5 Run the process like a professional
- Start building your buyer list early.
- Create competition, not just “a conversation.”
- Negotiate from strength: multiple interested parties beats one “maybe.”
11. How an AI-Native M&A Advisor Helps
Selling a pest control business is not just about finding one buyer. It is about creating the conditions where multiple qualified buyers compete, believe your numbers, and move quickly.
Higher valuations through broader buyer reach. An AI-native approach can expand the buyer universe to hundreds of qualified acquirers based on deal history, synergy fit, and financial capacity. More relevant buyers creates more competition, stronger offers, and more backup options if one buyer drops late.
Initial offers in under 6 weeks. AI-driven buyer matching, outreach, and faster creation of marketing materials can compress the timeline from “months of manual work” to initial conversations and early offers in weeks - while still keeping the process controlled.
Expert advisory, enhanced by AI. You still want experienced human M&A advisors running the process, setting strategy, and negotiating terms. The AI layer helps you present Wall-Street-grade materials, clean positioning, and buyer-specific messaging without paying traditional “bulge bracket” costs.
If you would like to understand how an AI-native process can support your exit, book a demo with one of Eilla AI’s expert M&A advisors.
Are you considering an exit?
Meet one of our M&A advisors and find out how our AI-native process can work for you.


