
The Complete Valuation Playbook for Pharmaceutical Development Businesses
A practical, data-backed guide to how pharmaceutical development businesses are valued today - and how to position yours for a higher multiple in the next 6-12 months.

If you run a privately held pharmaceutical development business and you are considering a sale in the next 1-12 months, your valuation will be driven by a mix of hard math (multiples) and buyer psychology (risk, scarcity, and strategic fit). Right now, this corner of pharma is in active consolidation: larger strategics want capabilities and product breadth, and private equity wants predictable cash flow with clear levers.
This playbook is designed to help you see what similar businesses actually sell for, understand what pushes multiples up or down, and take a practical self-assessment and action plan into a sale process with your eyes open.
1. What Makes Pharmaceutical Development Unique
“Pharmaceutical development” is a broad label. In practice, buyers see several business models that behave very differently in valuation:
- Generics and branded generics developers/manufacturers (small-molecule) - value driven by product registrations, supply reliability, margins, and commercial footprint.
- API and intermediate manufacturers - value driven by chemistry capability, cost position, regulatory track record, and customer concentration.
- CDMOs (contract development and manufacturing) - especially those with specialty capabilities (sterile, high-potency, biologics, viral vectors, fill-finish) - value driven by stickiness of programs, technical differentiation, and long-term contracts.
- Commercial-stage specialty or rare disease pharma - value driven by product moat, pricing power, and growth runway (often very high revenue multiples).
- Drug delivery / device-enabled platforms - value driven by proprietary IP that can be leveraged across many products.
Why valuation is different here versus “normal” businesses:
- Regulatory gravityA buyer is not just buying customers - they are buying licenses, registrations, quality systems, audits, and the right to keep selling. One compliance failure can wipe out a chunk of value.
- Supply chain and quality are part of your productIn pharma, “reliable supply” is a competitive advantage and a risk-control tool. Buyers will pressure-test your sourcing, redundancy, and quality metrics.
- Portfolio math mattersA pharma business is often a portfolio of “mini-businesses” (products or programs). Buyers care about concentration, lifecycle (patent cliffs, tender cycles), and what is truly durable versus one-off.
- The line between “services” and “assets” is blurryA CDMO with long-term contracts can look like a predictable cash-flow asset. A developer with little recurring demand can look like project work. That difference has huge multiple impact.
Key risks buyers always check (and price in):
- Regulatory status (GMP track record, warning letters, audit outcomes)
- Quality system maturity (deviations, CAPA closure discipline, data integrity)
- Customer concentration and contract structure
- Single-site or single-supplier dependency
- Product concentration (a few SKUs carrying the economics)
- Working capital volatility (inventory, receivables, tender cycles)
2. What Buyers Look For in a Pharmaceutical Development Business
Most buyers - strategic acquirers and private equity - start with the same basics:
- Scale and growth: stable or growing revenue, ideally with visibility into next year
- Profitability: gross margin and EBITDA margin that can hold up under scrutiny
- Cash conversion: how much EBITDA turns into actual cash after working capital and capex
- Durability: repeat orders, renewals, contracts, and low churn (where applicable)
Then the pharma-specific lens kicks in:
2.1 Strategic buyer thinking (corporate acquirers)
Strategics often pay more when you help them do one of these things faster than they could alone:
- Fill gaps in manufacturing footprint (region, dosage form, capacity)
- Add special capabilities (sterile, high-potency, biologics, viral vectors, complex injectables)
- Acquire regulatory breadth (registrations and ability to file/launch across markets)
- Strengthen supply reliability and reduce dependence on one geography
- Add commercial channels (hospital, specialty distribution, or targeted prescriber channels)
They will still be conservative if they see compliance or supply risk. Strategic appetite disappears quickly when quality is uncertain.
2.2 Private equity buyer thinking (how PE “underwrites” your business)
PE is buying your business with a plan to sell it again in 3-7 years. Their valuation logic is usually:
- Entry multiple vs exit multiple: if they buy you at 9x EBITDA, they want a credible story for selling at 10-12x later (or growing EBITDA enough to win even if exit multiple stays flat).
- Who is the next buyer? A larger strategic? A bigger PE fund? A public listing? If there’s no obvious “next owner,” valuation tightens.
- Levers they expect to pull:
- Pricing discipline (especially in branded generics or specialty channels)
- Mix shift (more complex products, fewer commodity SKUs)
- Operational efficiency (yield, scrap, line utilization)
- Add-on acquisitions (roll-up of complementary portfolios/capabilities)
- Commercial expansion (new geographies, new channels)
- Risk discounts: PE is particularly sensitive to customer concentration, weak financial reporting, and regulatory uncertainty because those blow up financing and exit options.
3. Deep Dive: The Valuation Nuance That Matters Most - “Commodity Platform” vs “Specialty Capability”
In this sector, one question often explains the biggest valuation gap:
Are you viewed as a “replaceable supplier” or as a “special capability that buyers can’t easily replicate”?
This shows up clearly in deal outcomes. In the precedent transactions dataset, CDMO/manufacturing assets with specialty capabilities achieved meaningfully higher EV/Revenue than more standard generics/distribution deals. For example, specialty CDMO and biologics-oriented platforms reached high-single-digit to low-double-digit revenue multiples in select transactions, while generics/distribution platforms were typically low-single-digit revenue multiples. (Examples in the data include BioVectra at ~8.2x EV/Revenue and Batavia at ~11.2x EV/Revenue versus generics/distribution examples such as ~1.4x to ~3.2x EV/Revenue.)
Why buyers care:
- Specialty capability creates scarcity: fewer credible suppliers, higher switching costs, more durable pricing.
- Specialty capability can “plug into” a buyer’s broader portfolio: if your platform helps them launch more products, expand modalities, or de-risk supply, the value is bigger than your standalone EBITDA.
- Compliance and technical depth become moats: a mature quality system plus specialized processes is hard to copy quickly.
How to move from “lower-value profile” to “higher-value profile” without reinventing the company:
Practical steps you can take in 6-12 months:
- Pick 1-2 capability lanes you can credibly own (sterile, high-potency, complex injectables, controlled substances, hard-to-make APIs) and prove it with customer evidence.
- Convert repeat work into contracts (even if not perfect - start with volume commitments, preferred supplier status, or longer-term MSAs).
- Package your quality story: trend data, audit outcomes, deviation discipline, supplier qualification, and release performance.
4. What Pharmaceutical Development Businesses Sell For - and What Public Markets Show
Here’s the cleanest way to use the data: private deal multiples show what buyers have actually paid, and public multiples show what the market is willing to value at scale. Your valuation usually sits somewhere between them, adjusted for your size, growth, margins, and risk profile.
4.1 Private Market Deals (Similar Acquisitions)
Across the precedent transactions dataset, you can see clear “bands” by business type:
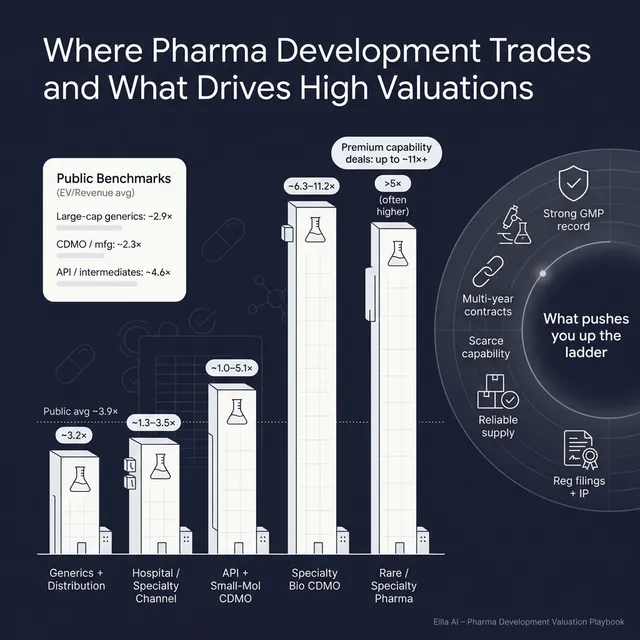
- Generics / distribution / branded generics assets: often ~1.4x to ~3.2x EV/Revenue in the examples provided, with value linked to supply reliability, margin profile, and portfolio breadth.
- Hospital/specialty commercialization and distribution: roughly ~1.3x to ~3.5x EV/Revenue in the examples.
- API and small-molecule CDMOs: around ~0.8x to ~8.2x EV/Revenue, with the high end tied to specialized capabilities and strong margins/retention.
- Biologics/vaccines/advanced therapy CDMOs: examples show ~6.3x to ~11.2x EV/Revenue for platforms with strategic scarcity.
- Commercial-stage specialty/rare disease biopharma: much higher, often >5x and sometimes far above 10x EV/Revenue, driven by product differentiation and growth runway.
A simple founder-friendly way to read this:
These ranges are illustrative. Your exact multiple depends on your growth, margins, risk profile, and how competitive your sale process is.
4.2 Public Companies (reference point as of mid-to-late 2025)
Public market multiples vary by subsector. In the public comps dataset, the overall average and median EV/Revenue are both ~3.9x, and the overall average and median EV/EBITDA are both ~21.6x. Subsector differences are large.
A helpful summary of the public group averages:
How to use public multiples correctly:
- Treat them as a reference band, not a price tag.
- Expect downward adjustments for smaller scale, concentration risk, or weaker reporting.
- In some cases, you can earn upward adjustments if you have scarce capabilities, unique regulatory assets, or strong strategic fit (especially when multiple buyers want you).
5. What Drives High Valuations (Premium Valuation Drivers)
Premium outcomes in this space usually come from one idea: buyers pay more when they believe your cash flows are durable and your capabilities are scarce. The dataset’s premium drivers map neatly into a few themes:
5.1 Strategic consolidation value in generics and distribution
In the generics/distribution cohort, buyers paid low-single-digit EV/Revenue (examples include ~1.4x, ~2.0x, ~2.8x, ~3.2x) when the asset strengthened a platform through registrations, supply, and cross-sell potential.What creates a premium within this “moderate multiple” band:
- Breadth of registrations across markets
- Reliable supply and strong service levels
- Above-peer gross and EBITDA margins
- Complex dosage forms (harder to replicate)
5.2 Specialty manufacturing capability that creates scarcity
The data shows clear premiums when manufacturing or logistics is specialized: biologics/viral vectors, high-potency, regulated cold chain, or similar scarcity-driven assets. Examples include high-single-digit EV/Revenue for a specialty CDMO and double-digit EV/Revenue for certain biologics/vaccine capability deals.What buyers pay up for:
- Capability depth that takes years to build (not months)
- Long-term contracts and program stickiness
- Margin resilience even when volumes fluctuate
5.3 Platform IP that can be leveraged across many products
Delivery/device platforms earned premiums because they “plug into” many products, not just one. In the dataset, delivery-focused assets were bought at mid-single-digit EV/Revenue with high EV/EBITDA in some cases.Founder translation:
- If you own a platform that helps a buyer improve multiple products, you are no longer a single-business - you are a multiplier.
5.4 High-margin commercial platforms (rare/specialty)
Rare disease and specialty commercial platforms earned higher multiples when pricing power, high gross margins, and a clear growth runway existed. The data includes examples of ~5x-7x EV/Revenue for rare/specialty commercial platforms and much higher revenue multiples for certain high-growth assets.The key is not “biopharma is always high multiple.” It’s:
- Defensible product moat (IP, exclusivity, differentiation)
- Strong margin structure
- Clear path to scale
5.5 The “boring” fundamentals that still matter
Even if they’re not listed as “premium drivers” in the dataset, these are the things that turn interest into higher bids:
- Clean financials with clear segment reporting (by product line/site/customer)
- Predictable revenue and repeat orders
- Diversified customers and products
- Strong second-line leadership (not all risk sitting with you)
- A credible capex plan (what’s required vs optional)
6. Discount Drivers (What Lowers Multiples)
Discounts in this sector are rarely about one issue. Buyers “stack” risks, and each one pushes your multiple down.
6.1 Regulatory and quality uncertainty
This is the fastest value killer:
- Weak audit history or open findings that don’t have credible closure
- Data integrity concerns
- High deviation rates or slow CAPA closure
Even if revenue is strong, buyers price in the possibility of a disruption.
6.2 Customer, product, or site concentration
If one customer, one product family, or one facility is “the business,” buyers will protect themselves with:
- lower upfront price
- earn-outs
- escrow/holdbacks
- tighter reps and warranties
6.3 Commodity economics
Common signals:
- heavy reliance on tender cycles with margin compression
- short-term purchase orders with no visibility
- “me too” product mix with little differentiation
6.4 Working capital volatility and cash leakage
Pharma businesses can look profitable on EBITDA but weak on cash:
- inventory builds for uncertain demand
- slow receivables
- batch failures and write-offs
- capex surprises
If buyers can’t forecast cash, they don’t pay premium multiples.
6.5 Weak reporting and unclear story
If your numbers can’t answer simple questions (by product, by customer, by site), buyers assume the worst and price accordingly.
7. Valuation Example: A Pharmaceutical Development Company
This is a fictional worked example to show the logic. The company and the USD 10m revenue are fictional, and the valuation ranges are illustrative - not investment advice or a formal valuation.
Step 1: The logic
- Start with the most relevant “multiple band” for your business model:
- Generics/distribution platforms trade in low-single-digit revenue multiples in the precedent examples.
- Specialty CDMO assets can be much higher if capabilities are scarce and contracts are sticky.
- Cross-check against public comps:
- Public large-cap generics average around ~2.9x EV/Revenue, while other subsectors trade higher depending on growth and capability.
- Choose a core range and adjust:
- Up for specialty capability, long-term contracts, margin resilience, strong compliance track record.
- Down for concentration risk, regulatory uncertainty, commodity mix, weak cash conversion.
Step 2: Apply it to a fictional business
Fictional Company: “NorthBridge Pharma Development”
- USD 10m revenue
- Business: small-molecule generics developer + contract manufacturing for third parties
- Strengths: broad regulatory filings in multiple countries, strong on-time release, decent margins
- Weaknesses: one facility dominates output; contracts are mostly short-term POs
Now apply scenarios:
What would justify the premium case here?
- credible move into complex dosage forms or higher-barrier manufacturing
- multi-year supply agreements with key customers
- strong, defensible quality track record and redundancy plans
- margin profile that looks more like “specialty capability” than “commodity supplier”
Step 3: What this means for you
Two businesses can both have USD 10m revenue and still be worth very different amounts. The difference is not magic - it’s how buyers score:
- durability (repeatable demand, contracts, resilience)
- scarcity (capabilities that are hard to replicate)
- risk (quality/regulatory, concentration, cash volatility)
Your job in the next 6-12 months is to turn “maybe” into “underwriteable.”
8. Where Your Business Might Fit (Self-Assessment Framework)
Use this as a quick positioning tool. Score each factor 0-2:
- 0 = weak / unclear
- 1 = decent
- 2 = strong / buyer-ready
Self-assessment table
How to interpret your total score (rough guide):
- Top band: You look like a “premium within your category” asset. You can often run a more aggressive process.
- Middle band: You are in fair-market territory. Process quality and buyer competition matter a lot.
- Lower band: You will likely face discounts, earn-outs, or tougher diligence. The good news is many fixes are very doable in 6-12 months.
9. Common Mistakes That Could Reduce Valuation
9.1 Rushing the sale
If you start a process before your numbers and story are clean, buyers will anchor low and stay there. In pharma, early confusion becomes “risk” very quickly.
9.2 Hiding problems
Quality issues, customer churn, batch failures, or regulatory correspondence will surface in diligence. If a buyer discovers you hid something, trust breaks and pricing collapses. It’s usually better to disclose issues with a credible fix plan than to pretend they don’t exist.
9.3 Weak financial records
This is fixable - and valuable to fix. Common gaps:
- revenue not clearly broken down by product/customer/channel
- unclear inventory and write-offs
- margins not explainable by site or product line
If you can’t explain your economics, buyers will assume they are worse than they look.
9.4 No structured, competitive process
A structured, competitive sale process with an advisor typically leads to meaningfully higher purchase prices - often cited around ~25% higher - because it creates real price discovery and leverage. (It’s not a guarantee, but the direction is consistent.)
9.5 Revealing what price you want too early
If you tell buyers “we want USD 50m,” many will respond with USD 50.1m, USD 50.2m offers instead of showing what they would truly pay. You want the market to reveal its willingness, not to cap it.
9.6 Industry-specific: treating quality as “back office”
In pharma development, quality is not overhead. It is a core value driver. If your quality story is weak, the rest of your narrative will struggle no matter how good the growth looks.
10. What Pharma Development Founders Can Do in 6-12 Months to Increase Valuation
Think in four workstreams: improve the numbers, de-risk the story, sharpen the differentiation, and run a better process.
10.1 Improve the numbers (without fake cosmetics)
- Tighten gross margin drivers: yields, scrap, line utilization, procurement savings
- Reduce working capital volatility: inventory discipline, receivables collection, clearer demand planning
- Clarify segment reporting: by product family, customer, site - so buyers can underwrite what’s real
10.2 De-risk your business (the “buyer confidence” work)
- Build a diligence-ready quality pack: audit history, deviation/CAPA metrics, supplier qualification, batch release performance
- Address single points of failure: second-source critical inputs, redundancy plans, documented business continuity
- Convert repeat work into contracts: MSAs, preferred supplier agreements, longer-term supply commitments
10.3 Strengthen your “scarcity” narrative
- Pick 1-2 capability lanes and prove them (sterile, high-potency, complex injectables, challenging APIs)
- Build evidence: customer wins, repeat programs, technical success stories, validation milestones
- Show why switching away from you is painful (qualification time, regulatory hurdles, process know-how)
10.4 Prepare for a disciplined sale process
- Build a clean data room early (financials, quality, contracts, regulatory)
- Write a simple, credible equity story:
- what you do
- why you win
- why revenue and margins are durable
- what growth looks like without heroics
- Map buyer types:
- strategics that value your footprint/capabilities
- PE buyers that value cash flow and consolidation paths
11. How an AI-Native M&A Advisor Helps
Selling a pharma development business is heavy lift: the buyer universe is global, diligence is intense, and the best outcomes usually come from running a competitive process with the right narrative and evidence.
An AI-native M&A advisor helps in three practical ways. First, higher valuations through broader buyer reach: AI can expand the buyer universe to hundreds of qualified acquirers based on deal history, strategic fit, financial capacity, and capability gaps. More relevant buyers means more competition, stronger offers, and more options if one buyer drops.
Second, initial offers in under 6 weeks: AI-driven buyer matching, faster outreach, and rapid creation of marketing materials can compress timelines. Combined with strong diligence preparation, you can get to real conversations and initial bids much faster than manual-only processes.
Third, expert advisory enhanced by AI: you still need experienced humans driving the process - especially in pharma where diligence and negotiation are nuanced. The advantage is Wall Street-grade positioning, materials, and buyer management without the traditional “bulge bracket” cost structure.
If you’d like to understand how an AI-native process can support your exit, book a demo with one of our expert M&A advisors.
Are you considering an exit?
Meet one of our M&A advisors and find out how our AI-native process can work for you.


