
The Complete Valuation Playbook for POS System Businesses
A data-driven breakdown of how POS system businesses are valued today and what drives high multiples.

If you run a POS system business and you might sell in the next 1-12 months, valuation is no longer a “later” problem. POS is in a consolidation wave: buyers are stitching together POS, payments, loyalty, inventory, payroll, and industry-specific workflows into full operating systems - and they’re paying very different multiples depending on how your revenue is built and how hard you are to replace.
This playbook is a practical guide built for POS founders. It will (1) show what POS businesses actually sell for using recent deal data and public market reference points, (2) decode what drives higher vs lower multiples in this sector, and (3) give you a simple self-assessment plus a 6-12 month action plan to improve your outcome.
1. What Makes POS System Businesses Unique
POS businesses sit in a weird (and valuable) intersection of software, payments, and often hardware. That mix is exactly why valuations swing so widely: buyers don’t pay for “POS” as a label - they pay for the shape of your revenue and your control of daily workflows.
The main types of POS businesses buyers see:
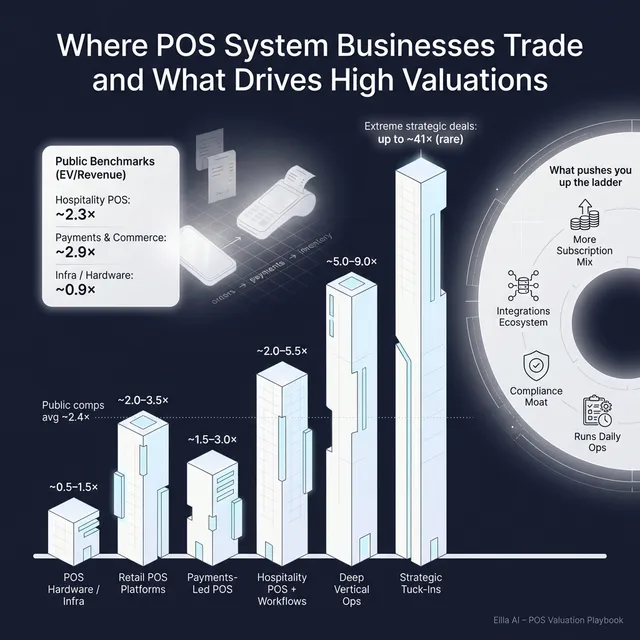
- Hospitality and restaurant POS platforms (often software + hardware + payments + add-ons like online ordering). Public comps in this bucket show a wide EV/Revenue spread, from well under 1.0x to above 2.0x, and occasionally much higher for more software-heavy platforms.
- Retail POS and commerce platforms (POS plus inventory, omnichannel, integrations, and localized compliance).
- Specialized vertical POS (built for one niche like salons, auto, cannabis, etc.) where “fit” can drive stickiness.
- POS infrastructure and hardware-forward providers where revenue can look more like equipment and services than software.
- Payments-led platforms with POS distribution where the buyer underwrites you like a payments company (lower software-like multiples if margins and retention behave like payments).
Unique valuation considerations in POS:
- Revenue quality is everything. A dollar of pure subscription software revenue is valued differently than a dollar of payments revenue (take-rate) or a dollar of hardware pass-through.
- Switching costs are real - but only if you prove them. POS can be sticky, but buyers will ask: “If we raise price, will merchants leave?”
- You carry operational and compliance risk. Outages, chargebacks/fraud exposure (if payments), device supply chains (if hardware), and country-specific fiscal rules can all show up as valuation discounts.
Key risk factors buyers will always check in POS:
- Payment dependency risk: are you tied to one processor/acquirer? What happens if economics change?
- Hardware complexity: returns, breakage, warranty, inventory, and installation costs.
- Security and compliance: PCI, data handling, and industry-specific fiscalization/e-invoicing requirements.
- Customer concentration: one chain can look great until it’s 25% of revenue.
2. What Buyers Look For in a POS System Business
Most buyers (strategic acquirers and private equity) value POS businesses using a simple mental model:
- Is this revenue durable? (customers stick around, pay reliably, and expand over time)
- Is it scalable? (gross margin, support burden, implementation effort, and product delivery)
- Is it strategically important? (payments attachment, workflow ownership, compliance moat, integrations/ecosystem)
What “good” looks like in practice:
- High recurring mix and clear packaging. Subscription revenue and contracted recurring fees are easier to value than variable, low-margin hardware.
- Strong gross margin and improving EBITDA. Public POS and commerce companies show that profitability can be valued very differently depending on mix - many platforms trade on revenue, but EBITDA multiples matter once you’re consistently profitable.
- Retention with proof. Buyers want cohort retention, churn by segment, and evidence that multi-location customers are hard to win and hard to lose.
- Payments and “revenue density.” If you run payments, buyers want: penetration (attach rate), payment volume growth, stable take-rate, and low losses.
How private equity thinks about your POS business
Private equity will ask: “If we buy you today, can we sell you for more in 3-7 years?”
They care about:
- Entry multiple vs exit multiple: they want to buy at a reasonable price and exit at a higher multiple by improving growth, margins, and predictability.
- Who the next buyer is: a larger POS/payments platform, a vertical software consolidator, or a scaled payments company.
- The levers they can pull:
- Raise prices where you have switching costs
- Increase payments attachment
- Cross-sell add-ons (loyalty, ordering, inventory, payroll)
- Reduce services drag and support costs
- Consolidate smaller tuck-in acquisitions (if you’re a platform)
If your story is “we have great product but growth is flat and margins are messy,” PE will still look - but the multiple will reflect the work they need to do.
3. Deep Dive: Payments Attachment vs Pure POS - Why It Changes Your Multiple
Here’s the big valuation nuance in POS: adding payments can increase your strategic value, but it can also pull your multiple down if your revenue starts behaving like a payments business rather than software.
Why this matters: the same POS product can be valued very differently depending on whether you are:
- A software platform that happens to offer payments, or
- A payments distributor that happens to offer software
How this shows up in the data:
- Public comps show payments and commerce processing platforms often trade around ~2.9x average EV/Revenue (median ~2.0x), with ~11.3x EV/EBITDA (median ~11.5x).
- Public comps in hospitality POS platforms (SaaS + hardware) average ~2.3x EV/Revenue but the median is ~1.0x, and EV/EBITDA medians are under 10x in that group - a sign that mix and scale matter a lot.
- In private deals, platforms where payments are integrated into workflows (not bolted on) show premiums when they demonstrate durability and monetization (examples include transaction platforms and payment-adjacent SaaS outcomes).
Why buyers care:
- Payments can be a powerful moat if you have high attachment and operational embedment (you’re “in the flow” of transactions).
- But payments revenue is often lower margin, more regulated, and can be vulnerable to pricing pressure - which can cap revenue multiples.
How to move from a lower-value profile to a higher-value profile:
Practical steps founders take in 6-12 months:
- Separate and explain revenue streams (subscription vs payments vs hardware) so buyers don’t default to the lowest-quality bucket.
- Prove payments attachment by segment (single-site vs multi-location) and show the trend line.
- Show software-led expansion: add-on penetration, module attach rates, and net retention by cohort.
4. What POS System Businesses Sell For - and What Public Markets Show
This is the part founders usually want first: “What multiple should I expect?” The honest answer is: it depends on your mix, growth, and stickiness. But the data does give you a reference band.
Below are two lenses:
- Private market precedent transactions (what similar assets sold for)
- Public market trading multiples (what the market pays for scaled, liquid companies - as of mid/end 2025 in your dataset)
4.1 Private Market Deals (Similar Acquisitions)
The precedent deal set is mixed, but the patterns are useful:
- Hospitality POS and transaction software deals show a wide spread: the group median EV/Revenue is ~4.1x, while the average is ~10.0x because a few small, strategic acquisitions at very high multiples pull the average up.
- Deal examples in the data range from ~2.2x EV/Revenue (more platform/retail management style) to ~5.2x, ~6.3x, and even ~9.0x for deep vertical hospitality software. There is also an extreme outlier at ~41.4x on very low revenue, reflecting strategic value rather than financial multiples.
- Takeaway: most credible, financeable POS software deals cluster in a mid-single-digit revenue multiple band, with higher outcomes reserved for “mission-critical vertical software” and lower outcomes for hardware/services heavy mixes.
A simple way to think about it:
These ranges are illustrative, not a promise. Your multiple will move based on the drivers in Sections 5 and 6.
4.2 Public Companies
Public multiples provide a “reference band,” not a direct price tag. Public companies are larger, more diversified, and have daily liquidity - private deals usually discount for smaller scale and higher risk.
From your dataset, the grouped averages look like this:
Public “sanity check” examples in the same dataset show EV/Revenue around ~0.7x to ~2.5x for several POS platforms, and ~6.3x for a more software-heavy hospitality platform - reinforcing that mix and software depth matter a lot.
How to use public multiples intelligently:
- Treat them as upper/lower boundaries, not “my price.”
- Smaller private companies often trade below public comps due to scale, customer concentration, and key-person risk.
- You can trade above some public comps if you are scarce and strategic (unique vertical depth, compliance moat, or exceptionally strong payments attachment with durable economics).
5. What Drives High Valuations (Premium Valuation Drivers)
Premium outcomes in POS are rarely about one metric. They come from a story buyers believe and evidence that the story is real. Based on the deal patterns and buyer commentary in your sources, here are the biggest themes.
5.1 Deep vertical fit and mission-critical workflows
Buyers pay more when your POS is not “a register,” but a system that runs daily operations. In the data, hospitality operations software embedded in workflows (appointments, ordering, kitchen flow, task management, food safety) is repeatedly associated with premium outcomes.
What to show:
- Multi-module adoption (not just POS)
- Proof that operations improve (fewer errors, faster turns, better labor compliance)
- Low churn in multi-location accounts
5.2 Integrated payments that increase revenue per customer
Integrated payments can lift valuation when it increases “revenue density” per merchant and lowers churn. Several precedent deals and commentary highlight that payments plus workflows can be valued even when profitability is not perfect - because buyers underwrite long-term retention and monetization.
What to show:
- Payments attach rate and growth
- Take-rate stability
- Expansion of payment volume per cohort
5.3 Regulatory and fiscal compliance as a moat
Localization, tax complexity, fiscalization, and compliance certifications can create real switching costs. In the data, compliance-heavy solutions in POS/retail and hospitality show stronger buyer confidence because they reduce “rip-and-replace” risk.
What to show:
- Certifications and country-specific readiness
- Customers in strict jurisdictions
- A repeatable rollout playbook across regions
5.4 Ecosystem integrations and platform connectivity
POS rarely wins alone. Buyers pay more for platforms that plug into accounting, delivery marketplaces, PMS (hotels), loyalty, inventory, and payroll. The data repeatedly links broad integration ecosystems to defensibility and cross-sell.
What to show:
- Integration adoption metrics (not just “we have 60 integrations”)
- Partnerships that actually drive pipeline
- Evidence that integrations reduce churn and increase ARPU
5.5 Automation and measurable operational ROI
AI and automation are not valuable because they sound modern - they’re valuable when they measurably reduce labor cost, errors, or compliance incidents. The deal set includes automation-led assets being acquired at very high multiples when the buyer believes ROI is real and scalable.
What to show:
- Before/after metrics in customer case studies
- Payback period for the customer
- Product features that reduce labor or waste in a provable way
5.6 High-margin recurring revenue with a clear upsell motion
Founders sometimes underestimate how much gross margin and recurring mix affect valuation. In the data, high gross margins and recurring SaaS economics correlate with stronger EBITDA multiples and buyer confidence.
What to show:
- Clear subscription packaging
- Gross margin by revenue stream
- Upsell motion from core POS into add-ons
5.7 Strategic buyer synergy and “integration readiness”
Strategic acquirers often pay more when they can plug you into their distribution or product suite quickly. Several deals in the dataset include explicit synergy expectations - that’s often where premiums come from.
What to show:
- A credible integration roadmap
- Where a buyer can cross-sell your product (and vice versa)
- How costs can come out post-close without breaking the product
6. Discount Drivers (What Lowers Multiples)
Discounts usually happen when buyers feel uncertainty - about the numbers, the retention, the unit economics, or the true cost to run the business.
Common discount drivers in POS:
- Revenue quality blur: if you bundle subscription, payments, hardware, and services without clean reporting, buyers will price you like the lowest-quality bucket.
- Low gross margin due to hardware/services mix: hardware pass-through and heavy implementation can cap revenue multiples.
- Weak retention proof: “Our customers love us” is not a metric. If churn data is messy or segmented poorly, buyers assume the worst.
- Customer concentration: one chain deal can look like product-market fit - until a buyer sees renewal risk.
- High support burden: if each deployment requires lots of human effort, scaling looks expensive.
- Payments risk: reliance on a single processor, unstable take-rate, chargeback exposure, or contract terms that can be repriced.
- Security and compliance gaps: missing PCI discipline, weak incident history documentation, or unclear data handling.
The good news: many of these are fixable in 6-12 months with focused work, especially reporting clarity and retention proof.
7. Valuation Example: A POS System Company
This is a worked example to show the logic, not to predict your price.
Fictional company: HarborPOSRevenue (fictional): USD 10.0mBusiness profile (intentionally realistic):
- Hospitality POS + lightweight restaurant operating system
- Integrated payments (meaningful, but not 100% attach)
- Some hardware revenue (terminals and peripherals)
- Growing, but not “hypergrowth”
- Gross margin is mixed due to payments + hardware
Step 1: Build a base multiple range from relevant comps
A sensible starting point comes from the most directly comparable bands in your source logic:
- A “hospitality POS + restaurant OS” public reference band supports ~1.3x-3.1x revenue as an initial anchor.
- Payments-like comps provide a downside anchor (often lower on revenue multiple when revenue behaves like payments).
- Private market software deals can support higher ranges when the business looks more like high-margin, sticky vertical SaaS - but you should earn that with proof.
A practical, founder-friendly way to translate that:
- Base case: you’re valued like a POS platform with mixed revenue quality
- Premium case: you’re valued more like embedded vertical software with strong payments attachment and low churn
- Discount case: you’re valued like payments/hardware with unclear retention and heavy services drag
Step 2: Apply it to HarborPOS (USD 10.0m revenue)
How this ties back to the source logic:
- The provided logic suggested a base EV range of roughly USD 13m-40m for a hospitality POS + payments hybrid at USD 10m revenue (roughly ~1.3x-4.0x) - with limited upward flexibility absent clear premium drivers.
- The premium scenario above shows what happens if you do build and evidence the premium drivers (mission-critical workflows, compliance moat, strong attach, high margin software mix). It’s illustrative - not a guarantee.
Step 3: What this means for you
Two POS businesses can both have USD 10m revenue, and one can sell for USD 15m while the other sells for USD 60m. The difference is not “luck.” It’s:
- How recurring and high-margin the revenue is
- How provable retention is
- How embedded you are in daily operations
- Whether buyers see you as software-first (premium) or payments/hardware-first (discount)
This is not investment advice or a formal valuation - it’s a simplified example to make valuation mechanics understandable.
8. Where Your Business Might Fit (Self-Assessment Framework)
Use this to pressure-test where you likely land in the valuation spectrum. Score each factor 0 / 1 / 2:
- 0 = weak or not proven
- 1 = okay but inconsistent
- 2 = strong and documented
How to interpret your total score (rough guide):
- Top band: you likely have the ingredients for premium outcomes (if you run a good process).
- Middle band: fair market outcomes - you’ll benefit most from tightening proof (retention, margins, reporting).
- Lower band: buyers will see work and risk - consider whether 6-12 months of cleanup will pay back.
The goal is not to “win” the score. The goal is to see where improvements have the biggest valuation payoff.
9. Common Mistakes That Could Reduce Valuation
9.1 Rushing the sale
If you sprint into a process with messy numbers and an unclear story, buyers will anchor low and stay there. A clean process often takes longer before launch (prep) and less time during diligence.
9.2 Hiding problems
Every weakness gets found in diligence. If you hide churn, outages, a key processor dependency, or a margin problem, you don’t just lose price - you lose trust, leverage, and sometimes the deal.
9.3 Weak financial records
This is fixable and it matters. POS businesses need clean reporting that separates:
- Subscription/software revenue
- Payments revenue (and take-rate)
- Hardware revenue (and margin)
- Services revenue (and margin)
If buyers can’t see the mix, they’ll assume the mix is bad.
9.4 Not running a structured, competitive sale process with an advisor
A structured process creates competition and forces buyers to bid against each other. Research commonly cited in M&A circles shows that running a competitive process with an advisor is associated with meaningfully higher prices (often quoted around ~25% uplift). Even if the exact number varies, the direction is consistent: competition improves outcomes.
9.5 Revealing what price you’re after too early
If you tell buyers “we want USD 10m,” you cap price discovery. Many buyers will come back with USD 10.1m, USD 10.2m - instead of the real maximum they would have paid in a competitive process.
9.6 POS-specific mistake: letting “payments confusion” contaminate your story
If your deck and data make it unclear whether you’re a software company or a payments company, buyers will default to lower multiples. You need a clean narrative and clean reporting that shows why your economics deserve software credit.
10. What POS Founders Can Do in 6-12 Months to Increase Valuation
You don’t need a massive pivot. You need focused improvements that change how buyers underwrite risk and upside.
10.1 Make revenue quality undeniable
- Rebuild reporting so buyers can clearly see subscription vs payments vs hardware vs services.
- Improve subscription packaging and reduce one-off fees where possible.
- Track and present gross margin by stream - buyers hate blended ambiguity.
10.2 Prove retention and expansion (not just “usage”)
- Produce churn and net retention by cohort (especially multi-location).
- Show module attach rates and upsell penetration.
- Build 3-5 case studies with measurable outcomes (labor savings, error reduction, faster service, fewer compliance incidents).
10.3 Increase payments attachment without becoming “just payments”
- Improve attach rate through product and onboarding, but keep the narrative anchored in operational value.
- Show payment volume growth and take-rate stability over time.
- Reduce processor dependency risk (better contracts, backup options, or clearer economics).
10.4 Reduce operational drag that scares buyers
- Decrease implementation effort per location (standardize deployments, better tooling).
- Invest in support scalability (self-serve, better training, tiered support).
- Document security/compliance posture so diligence doesn’t become a fear spiral.
10.5 Build a buyer-ready story and process
- Build a crisp “why we win” narrative: vertical depth, switching costs, payments density, and ecosystem position.
- Prepare diligence materials before you launch (customer cohorts, contracts, uptime history, processor terms, hardware margin).
- Run a competitive process that creates urgency and preserves leverage.
11. How an AI-Native M&A Advisor Helps
A strong exit is usually less about finding a buyer and more about finding the right set of buyers and creating real competition. An AI-native advisor expands the playing field: instead of starting with a shortlist, AI can map hundreds of qualified acquirers based on deal history, synergy fit, financial capacity, and other signals. More relevant buyers means more competition, stronger offers, and more backup options if one bidder drops.
Speed matters too. AI-driven buyer matching, outreach, and faster creation of marketing materials can compress timelines, helping you reach initial conversations and offers in under 6 weeks in many processes - while still keeping the process structured.
You still need human judgment. The best outcomes come from expert advisors who can frame your story credibly, anticipate buyer concerns, and run a tight process - with AI enhancing the reach, the targeting, and the execution quality. The goal is “Wall Street-grade” process quality without traditional bulge bracket costs.
If you’d like to understand how our AI-native process can support your exit, book a demo with one of our expert M&A advisors.
Are you considering an exit?
Meet one of our M&A advisors and find out how our AI-native process can work for you.


