
The Complete Valuation Playbook for Robotics Businesses
A data-driven guide to how robotics businesses are valued and what drives high multiples.

If you are a robotics founder thinking about a sale in the next 1-12 months, valuation is not just a “multiple.” It is the output of a buyer’s risk math: how repeatable your revenue is, how hard your system is to replace, and how confident they are that the next 3-5 years will look better than the last 12 months.
Robotics is also in a very “active but selective” moment. Many strategics and private equity buyers want automation exposure, but they are paying up mainly for businesses that look de-risked: real deployments, clear unit economics, and a path to scale.
This playbook is built from real robotics deal data and public-market multiples (largely mid-to-end 2025), plus the practical patterns that show up when buyers underwrite robotics businesses. It will:
- show what robotics businesses actually sell for (by segment),
- decode what drives higher vs lower multiples,
- and give you a self-assessment plus a practical 6-12 month action plan.
1. What Makes Robotics Unique
Robotics companies are unusual because you are often selling a product, a deployment motion, and a long-tail service relationship at the same time. That mix makes valuation very sensitive to what kind of robotics business you are.
The main “types” of robotics businesses buyers see
Most private and public comps cluster into a few business models:
- Warehouse and intralogistics systems: robots + orchestration software + integration into a warehouse workflow (often AMRs/AGVs, picking, sortation, conveyor-adjacent systems).
- Industrial robot OEMs: arms/cobots + controllers + ecosystem add-ons (often hardware-led, sometimes with software attach).
- Industrial automation integrators: turnkey custom automation projects and engineered systems (services-heavy).
- Machine vision, sensing, and perception platforms: cameras, lidar, inspection systems, SDKs - often higher gross margin when productized.
- Service robots: deployed in public or facilities environments (hospitality, delivery, cleaning) - sometimes “hardware + ops.”
- Defense/field/inspection robotics: UAV/UGV/ROV and specialized inspection - often “mission critical.”
Unique valuation considerations in robotics
Robotics valuation tends to hinge on three sector-specific questions:
- Is your revenue tied to an installed base that creates “follow-on” dollars?Buyers pay more when a robot deployment creates years of monitoring, software updates, parts, and expansion revenue - not just a one-time project.
- Is your system a product, or a project?Two companies can both call themselves “robotics,” but one is repeatable (productized, standardized deployments) and the other is custom engineering (hard to scale, harder to underwrite).
- Do the economics improve with scale - and can a buyer actually get you there?Robotics can look unprofitable at small scale due to manufacturing, field support, and integration costs. Buyers look for proof that margins improve as deployments repeat.
Key risk factors buyers always check
In robotics, buyers almost always stress-test:
- Reliability in the real world: uptime, failure rates, safety incidents, warranty exposure.
- Deployment complexity: how many weeks/months to deploy, how much customization, how dependent on your team.
- Gross margin quality: hardware margin vs software/service margin; warranty and support load.
- Customer concentration: a single enterprise pilot can make revenue look “real” while still being fragile.
- Supply chain and manufacturability: component dependencies, lead times, contract manufacturing readiness.
- IP defensibility: what is truly proprietary (and protected) vs integrator know-how.
2. What Buyers Look For in a Robotics Business
Buyers generally pay for reduced uncertainty. In robotics, uncertainty is everywhere (hardware, deployment, adoption, safety), so the “proof points” matter more than in many software categories.
The obvious fundamentals still matter
- Scale: larger revenue base and repeatable bookings reduce perceived risk.
- Growth: buyers want evidence the market is pulling the product, not that you are pushing it.
- Profitability (or a clear path): even if you are not profitable today, buyers want confidence that margins can improve with repeat deployments.
- Gross margin: in robotics, gross margin is often the quickest proxy for whether you have a product business or a services business wearing a product label.
The robotics-specific fundamentals that change the price
- Repeatability of deployments: do new installs look like the last ones, or are they all bespoke?
- Installed base economics: parts, maintenance, monitoring, software updates, expansions.
- Workflow “criticality”: if your robot stops, does the operation stop? Buyers pay more for “must-not-fail” systems.
- Data and software layer: buyers value when the robot improves over time and when customers depend on your software stack to operate.
- Safety and compliance posture: certifications, cybersecurity, and documented processes reduce risk and can expand your buyer universe.
How private equity thinks about you
Private equity (PE) is usually underwriting three things:
- What they pay today vs what they can sell for laterThey care about the “multiple” today, but they also care about the multiple in 3-7 years. A business with cleaner recurring revenue and better margins often gets a better multiple later.
- Who they can sell toTheir likely exit is often a larger strategic buyer or a larger PE fund. They want a business that looks even more “buyable” after a few years of improvements.
- The levers they expect to pullCommon PE levers in robotics:
- price discipline and better packaging (especially on service and software),
- improving gross margin through supply chain, standardization, and fewer one-off deployments,
- cross-sell into a bigger customer base,
- bolt-on acquisitions (especially in integrator-heavy categories),
- building a stronger leadership bench so growth does not depend on founders.
3. Deep Dive: The Highest-Impact Valuation Nuance in Robotics - Product vs Project (and How Recurring Revenue Changes the Multiple)
This one nuance explains a huge share of valuation outcomes in robotics: buyers pay more for productized, repeatable systems with recurring revenue, and they discount “project businesses” even if the top-line looks similar.
Why it matters
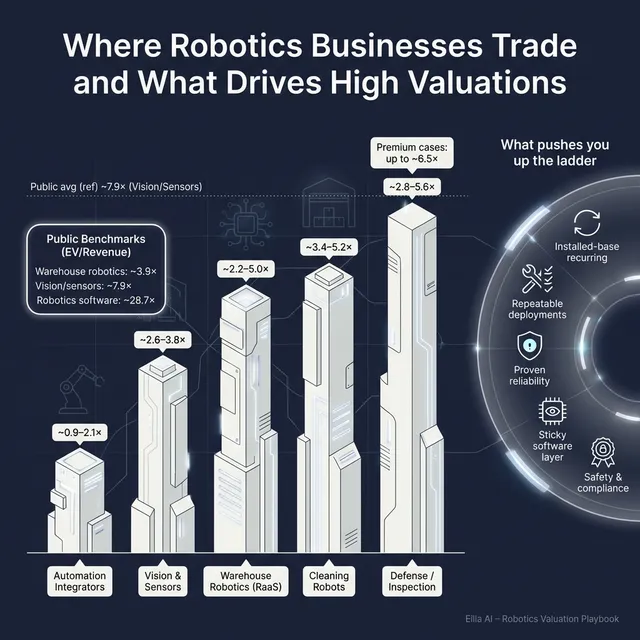
In the data, segments with strong installed-base and recurring dynamics routinely support stronger valuation outcomes than services-heavy integrators. For example, industrial automation integrators show lower revenue multiples in private deals (roughly 0.9x-2.1x EV/Revenue) than more productized robotics categories. Meanwhile, several product-plus-aftermarket or installed-base-heavy robotics deals land in mid-single-digit revenue multiples. (See Section 5.1.)
How this shows up in buyer behavior
Buyers will ask questions like:
- “If we sell 20 more units, does the business get easier - or harder?”
- “Do you need your best engineers on every deployment?”
- “Do customers pay you again after go-live, and do they pay more over time?”
If your answers feel like “it depends,” you are drifting toward the lower end.
What “higher value” looks like vs “lower value”
How to move right over 6-12 months
You do not need to reinvent your company - you need to make repeatability visible:
- Turn your last 5 deployments into a documented “deployment recipe” with time, cost, and roles.
- Standardize hardware configurations and limit custom options.
- Package software, monitoring, and maintenance into priced tiers (even if customers can opt out).
- Track and publish reliability metrics internally (uptime, intervention rate, mean time between failures). Buyers pay for evidence, not claims.
4. What Robotics Businesses Sell For - and What Public Markets Show
Multiples in robotics vary wildly because the category includes everything from services-heavy automation shops to high-margin sensing businesses to hype-driven early-stage public names. The useful approach is: anchor to the segment that matches your business model, then adjust up or down based on proof points.
4.1 Private Market Deals (Similar Acquisitions)
Here’s what the private deal data suggests across robotics-adjacent segments (EV/Revenue). These are illustrative ranges drawn from precedent transactions and group averages.
A few patterns show up repeatedly:
- Services-heavy mixes compress multiples even when revenue is sizable, because buyers see less predictability and scalability.
- Installed base + aftermarket (parts, monitoring, upgrades) supports stronger pricing because it looks more like recurring revenue.
- Mission-critical deployments with proven margins can earn a premium even in hardware-heavy businesses.
4.2 Public Companies
Public markets give a “reference band,” but you cannot copy-paste a public multiple onto a private business. Still, it’s useful context.
As of mid-to-end 2025, the public group averages by segment show big dispersion:
A practical way to use public comps:
- Treat them as a ceiling and a floor reference band, not a price tag.
- Adjust downward for smaller scale, customer concentration, uneven margins, and deployment risk.
- In rare cases, adjust upward if your asset is scarce and strategically important (for example, defensible perception IP that locks into a buyer’s stack).
5. What Drives High Valuations (Premium Valuation Drivers)
Premium outcomes in robotics are not magic. They are usually the result of reducing the buyer’s fear while increasing the buyer’s upside story. The deal data highlights several recurring “premium themes.”
5.1 Recurring revenue and installed-base economics (RaaS, service annuities)
Deals show that buyers pay up when hardware turns into a predictable stream: maintenance, monitoring, parts, software updates, and expansions. Examples in the data include businesses where installed base dynamics and follow-on services supported stronger strategic value.
What this looks like in your business:
- multi-year contracts (even if the first deal started as a pilot),
- software features that expand over time,
- measurable “expansion revenue” as customers add robots, sites, or modules.
5.2 Mission-critical autonomy with real margins
Premiums cluster where robotics is deployed in environments where failure is expensive (defense, offshore inspection, yield-critical manufacturing) and the business shows strong margins or a credible margin trajectory.
What to make visible:
- reliability metrics and uptime,
- contractual service levels (what you promise and how you perform),
- margin improvement as deployments repeat.
5.3 Proprietary perception/vision IP with a sticky software layer
Perception businesses with SDKs, software ecosystems, and deep integration can create switching costs - and that supports higher gross margins and stronger valuation narratives. The data includes perception and vision acquisitions where profitability and integration stickiness were highlighted.
What helps here:
- clear proof you outperform alternatives (accuracy, latency, robustness),
- a productized software layer that updates frequently,
- a developer/customer ecosystem that depends on your tools.
5.4 High-return end markets with clear ROI
Where customers get obvious payback (throughput gains, reduced labor, yield improvement), buyers see pricing power and durability. The data points to strong outcomes in segments like semiconductors, pharma/food throughput, and specialized inspection where “small improvements” produce big dollars.
What buyers love to see:
- ROI case studies (before/after),
- payback periods in plain language,
- outcomes customers care about (throughput, safety incidents, scrap reduction).
5.5 Regulatory and security “moats”
Clearances, safety certifications, and security posture can expand your buyer universe and shorten sales cycles with enterprise and government-linked customers. In the data, regulatory/security clearances show up as credibility signals in sensitive environments.
Practical steps:
- document safety certifications and compliance processes,
- treat cybersecurity as a product requirement (not an afterthought),
- maintain clean documentation that survives diligence.
5.6 “Integration-ready” platforms that strategics can scale
Strategic buyers pay for synergy: plug into their channels, complement their product line, and cross-sell into an installed base. Deal commentary highlights cases where acquirers expected synergies through shared customers, combined product coverage, or cost efficiency.
How to show this:
- standard interfaces and APIs,
- partnerships with WMS, conveyors, OEMs, or workflow software,
- evidence your deployments integrate smoothly in real environments.
Also: do not underestimate the basics. Clean financials, predictable revenue recognition, diversified customers, and a credible leadership bench are often the difference between “top of range” and “discounted.”
6. Discount Drivers (What Lowers Multiples)
Most low-multiple outcomes are not because the tech is bad. They happen because the buyer sees unpriced risk.
Common discount drivers in robotics:
- Too much custom work: if every deployment needs senior engineers, buyers price you like an engineering firm.
- Low visibility revenue: one-time hardware sales with no contract continuity.
- Weak gross margins or unclear margin story: especially if warranty, field support, or rework is unpredictable.
- Customer concentration: one big customer can turn a “growth story” into a “single point of failure.”
- Pilot-heavy pipeline: lots of interest, few scaled rollouts. Buyers want proof of repeat purchasing.
- Unclear reliability and support burden: if uptime is not measured, buyers assume the worst.
- Supply chain fragility: single-source components, long lead times, inconsistent manufacturing quality.
A helpful way to think about it: buyers will discount you hardest where fixing the issue would take them longer than they want to hold the asset.
7. Valuation Example: A Robotics Company
This example is fictional. The company, its characteristics, and the revenue level are made up to show how valuation logic works. This is not investment advice and not a formal valuation.
Step 1: The logic
- Pick the right peer group based on your true business model (product vs project, software vs systems, recurring vs one-time).
- Anchor to the most relevant private and public bands for that peer group.
- Set a “core range” that fits your scale and risk profile (private companies usually price below public comps).
- Adjust up for premium drivers that are proven (not just promised).
- Adjust down for visible risks (concentration, weak margins, heavy customization, unclear deployments).
In the underlying robotics data, a defensible “core band” for a hardware + integrated systems business with RaaS elements often clusters around ~2.5x-5.0x EV/Revenue, with an illustrative premium case reaching mid-single digits when recurring revenue and stickiness are strong.
Step 2: Apply it to a fictional company (USD 10m revenue)
Meet ForgeFleet Robotics (fictional):
- USD 10.0m annual revenue (fictional)
- Provides warehouse automation: AMRs + orchestration software + deployment
- Revenue mix: 60% contracts that include ongoing monitoring/maintenance, 40% one-time deployment and hardware
- Early evidence of repeat deployments in 2 verticals, but still some customization
A simple scenario table:
Step 3: What this means for you
Two robotics businesses with the same USD 10m revenue can reasonably be worth USD 25m or USD 65m depending on repeatability, margins, and revenue visibility.
The key is not “chasing a higher multiple.” The key is earning buyer confidence that your revenue is repeatable and your economics improve with scale.
8. Where Your Business Might Fit (Self-Assessment Framework)
Use this to place yourself roughly in the valuation spectrum. Score each factor 0 / 1 / 2:
- 0 = weak or unproven
- 1 = partially true / mixed
- 2 = clearly true, proven with data
Self-assessment table
How to interpret your total
- High band (mostly 2s): you resemble the “premium” profile - more likely to land near the top of your segment’s range.
- Middle band (mix of 1s and 2s): you can sell well, but you should expect buyers to push on risks and structure (earn-outs, holdbacks).
- Low band (many 0s): you may still sell, but outcomes skew toward lower multiples or more conditional structures unless you improve a few key items fast.
The goal is not to score perfectly. The goal is to identify the 2-3 upgrades that move valuation the most.
9. Common Mistakes That Could Reduce Valuation
9.1 Rushing the sale
If you start a process before your numbers and story are ready, buyers will fill gaps with worst-case assumptions. In robotics, that usually means “this is custom engineering” and “margins won’t improve.”
9.2 Hiding problems
Every deal has issues. What kills valuation is surprise. If churn, warranty costs, a failed deployment, or a customer dispute appears late, buyers lose trust and reduce price or add strict terms.
9.3 Weak financial records
Robotics businesses often have messy financials because hardware, services, and recurring contracts blend together. Buyers will discount you if you cannot clearly explain:
- what portion of revenue is recurring vs one-time,
- gross margin by product line,
- deployment costs and support costs.
9.4 Not running a structured, competitive process with an advisor
In practice, competitive tension is what drives pricing. Research often cited in M&A circles indicates that running a structured competitive process with an experienced advisor can increase purchase prices by around 25%, largely because it improves buyer reach, negotiation leverage, and process discipline.
9.5 Revealing your price too early
If you tell buyers you want “USD 10m,” many will anchor near that number instead of bidding what they could actually pay. You kill price discovery. Let the market speak first.
9.6 Robotics-specific mistake: letting “cool tech” replace “proof”
Robotics founders often lead with autonomy demos. Buyers lead with: “How often does it break, how long to deploy, and what does support cost?” If you cannot answer crisply, valuation suffers.
9.7 Robotics-specific mistake: unclear packaging of RaaS vs services
If your “RaaS” is really a bundle of hardware lease + heavy services, buyers may treat it like an integrator model. Clear packaging and margins matter.
10. What Robotics Founders Can Do in 6-12 Months to Increase Valuation
Think in three buckets: improve the numbers, reduce perceived risk, and sharpen the story.
10.1 Improve the numbers buyers underwrite
- Increase recurring share of revenue: move monitoring, maintenance, and software into contracted plans.
- Standardize deployments to lift gross margin: reduce custom engineering hours per install; productize configurations.
- Track and improve support cost: show decreasing intervention hours per robot/month as the product matures.
10.2 Reduce risk with “evidence packages”
- Build a reliability dashboard: uptime, failure rates, intervention frequency, warranty cost.
- Write a deployment playbook: timeline, staffing, prerequisites, and what changes vs stays constant.
- Create ROI case studies: labor reduction, throughput, yield improvement, safety benefits - with customer quotes if possible.
10.3 Make the business easier to buy
- Clean up financial reporting so a buyer can see recurring vs one-time revenue and margins by line.
- Reduce customer concentration where possible (even one additional meaningful customer can change risk perception).
- Build a small leadership bench so the business is not “founder-dependent” during a transition.
10.4 Tie actions directly to premium drivers
If your goal is to move closer to premium outcomes seen in robotics deals, focus on:
- making installed-base economics real (not aspirational),
- proving mission-critical reliability,
- productizing your software layer so customers depend on it,
- and demonstrating repeatable deployments.
11. How an AI-Native M&A Advisor Helps
The biggest driver of sale outcomes is usually not the spreadsheet - it’s who you reach, how you run the process, and how well you translate your robotics story into buyer language.
An AI-native M&A advisor can expand your buyer universe far beyond “who you already know.” By using deal history, synergy signals, and financial capacity to match your business to hundreds of qualified acquirers, you create more competition. More relevant buyers typically means stronger offers - and if one buyer drops, you are not back to zero.
Speed also matters. With AI-driven buyer matching, faster outreach, and rapid creation of strong marketing materials (plus structured support through diligence), you can often reach initial conversations and offers in under 6 weeks, instead of dragging into a slow, leaky process.
Finally, the best outcome usually combines technology with experience. You want seasoned human M&A advisors who know how to frame your business, run the process, and negotiate - enhanced by AI that improves reach, preparation, and execution. The result is “Wall Street-grade” process quality without traditional bulge-bracket costs.
If you’d like to understand how our AI-native process can support your exit, book a demo with one of our expert M&A advisors.
Are you considering an exit?
Meet one of our M&A advisors and find out how our AI-native process can work for you.


