
The Complete Valuation Playbook for Solar Energy Solutions Businesses
A data-driven guide to how Solar Energy Solutions businesses are valued and what drives premium multiples.

If you are considering a sale in the next 1-12 months, valuation is not just “a multiple” - it is the output of how buyers classify your business model, how much they trust your numbers, and how confident they are that your cash flows will hold up through policy, rate, and supply chain swings.
This playbook is built for founders and CEOs of privately held Solar Energy Solutions businesses. It will show what the data actually says about private deal multiples and public trading multiples, decode what drives higher vs lower outcomes, and give you a practical self-assessment plus a 6-12 month action plan to move your valuation in the right direction.
1. What Makes Solar Energy Solutions Businesses Unique
Solar is not one industry - it is a stack. And valuation depends heavily on where you sit in that stack.
Most “Solar Energy Solutions” businesses fall into a few buckets:
- Hardware OEMs and power electronics (inverters, storage, energy management)
- Module and component manufacturers (cells, panels, BOS materials)
- Distributors and specialty wholesalers (solar + storage + EV charging products to installers)
- EPC, installation, and O&M (residential, C&I, utility-scale; sometimes bundled with efficiency services)
- Developers and asset owners (IPPs) (projects, PPAs, contracted cash flows)
- Technical services / advisory (QA, testing, engineering, interconnection expertise)
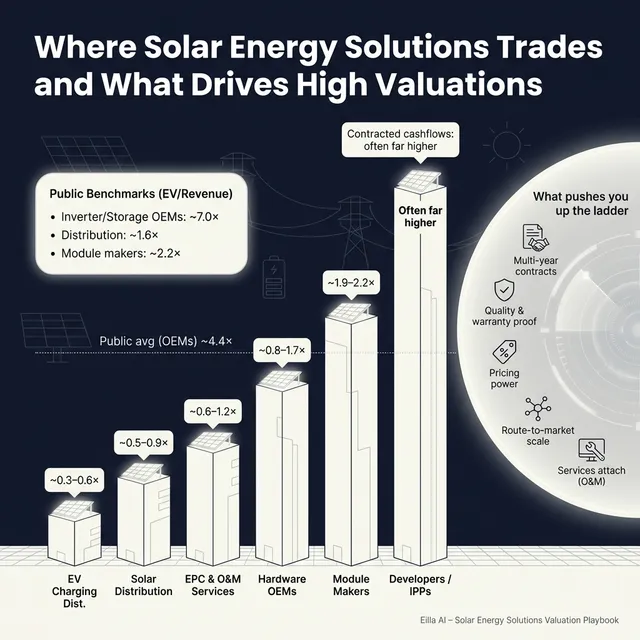
Why this matters: buyers do not value these categories the same way. Public market data shows very different “normal” bands by segment - for example, broad distribution tends to trade around ~0.9x EV/Revenue while inverter and storage OEMs can trade materially higher, and contracted generation platforms can be in an entirely different universe. (See Section 5.)
Unique valuation considerations buyers always pressure-test in solar:
- Policy and incentive sensitivity: how exposed your demand is to tariff changes, tax credits, net metering rules, or tender cycles.
- Working capital and inventory risk: solar hardware moves fast. Obsolescence, warranty returns, and price drops can hit margins hard.
- Quality and warranty tail: failure rates, warranty reserves, and who owns the liability (you vs OEM vs installer).
- Customer concentration and channel dependence: a few installer partners can look like “great relationships” or like “fragile dependency,” depending on contracts and switching costs.
- Execution risk (especially EPC): permitting, interconnection delays, subcontractor quality, safety record, and change order discipline.
2. What Buyers Look For in a Solar Energy Solutions Business
Buyers usually put you through two lenses at the same time:
Lens A: “How big and predictable is this profit stream?”
- Scale and growth rate (but quality of growth matters more than headlines)
- Gross margin stability (solar can be feast-or-famine if you are price takers)
- EBITDA margin and consistency (buyers pay for repeatability, not one good year)
- Clean financial reporting: monthly close discipline, margin by product line, and clear “what is recurring vs one-off”
Lens B: “What am I really buying here?”
- A route-to-market (installer network, branches, logistics, vendor terms)
- A capability (design, interconnection, commissioning, QA)
- A platform (something that can acquire smaller players or cross-sell adjacencies)
- Contracted cash flows (assets with long-duration revenue visibility)
How private equity (PE) thinks about your business
PE is usually underwriting a 3-7 year story:
- Entry vs exit multiple: they care what they pay today and what a bigger buyer might pay later.
- Who the next buyer is: a strategic (OEM, distributor, utility services platform) or a larger PE fund.
- The levers they expect to pull:
- Professionalize pricing and procurement
- Improve margins through mix, terms, and operating discipline
- Add bolt-ons (especially in distribution and services)
- Expand geography or customer segments
- Add recurring revenue (service plans, O&M, monitoring, QA, financing facilitation)
If you want PE bidders in your process, your job is to make the value-creation plan feel obvious and low-risk.
3. Deep Dive: Why “Recurring and Contracted Revenue” Drives Solar Valuation More Than Almost Anything
Here is the uncomfortable truth: in solar, two companies with the same revenue can be valued wildly differently because buyers care about visibility and durability more than the revenue number itself.
The data makes this clear:
- Public markets assign very different typical multiples to segments with different revenue quality - broad distribution groups trade around ~0.9x EV/Revenue, while inverter/storage OEMs are higher on average, and some contracted generation platforms can show far higher EV/Revenue due to long-duration cash flows and asset value.
- Private deal data shows distributor-like businesses clustering in sub-1.0x EV/Revenue ranges, while asset-backed developer/IPP deals can show much higher EV/Revenue because near-term revenue is not the point - long-lived contracted cash flows are. (Section 5.)
Why buyers care
Solar demand can be cyclical (rates, incentives, supply). Buyers pay up when you can prove:
- Customers come back (repeat purchase behavior, service attach, renewals)
- You have contract duration (O&M contracts, framework agreements, multi-year supply)
- You have pricing power (not just volume)
Moving from “lower-value profile” to “higher-value profile”
Below is the pattern buyers use - and what you can do about it.
Practical moves that work in 6-12 months:
- Add service attach (commissioning, extended warranty handling, preventative maintenance, monitoring)
- Convert top customers to annual frameworks (even if volumes flex, terms and commitment matter)
- Make margin defensible: documented pricing governance, rebate programs, vendor terms, and SKU profitability reporting
4. What Solar Energy Solutions Businesses Sell For - and What Public Markets Show
This is the part founders usually want first: “what’s the multiple?” The right answer is: which solar category are you in, and how clean is the story?
Also note: both public and private solar multiples can look “messy” because this sector includes:
- manufacturers with big cycles,
- service businesses with uneven project revenue,
- and asset platforms where revenue is a misleading denominator.
So you should use multiples as reference bands, not as a price tag.
4.1 Private Market Deals (Similar Acquisitions)
From the private deal groupings in the data, the “typical” EV/Revenue bands look roughly like this:
These ranges are anchored in the precedent transaction ranges provided (for example, distributor-like cohorts clustering sub-1.0x EV/Revenue, and solar hardware manufacturers often around ~1x-1.7x). They are illustrative and can move meaningfully based on your margin profile, concentration, and what kind of buyer is in the process.
One more important pattern from the deal context: many solar transactions include earnouts, deferred payments, or stock consideration. That is the market telling you: “We like the asset, but we want protection against downside or we want you to stay engaged.”
4.2 Public Companies
Public comps set the “gravity” of the market. They do not set your exact price - but they heavily influence how buyers justify what they can pay.
As of mid-to-late 2025, the grouped public multiples in the dataset show:
How to interpret this as a founder:
- Treat public multiples as outer reference bands.
- Private buyers typically adjust down for smaller scale, customer concentration, weaker reporting, and higher volatility.
- Sometimes they adjust up when the asset is scarce, strategically important, or can unlock cross-sell quickly.
5. What Drives High Valuations (Premium Valuation Drivers)
The data shows premiums tend to appear when buyers believe your margin and demand are defensible - not just “good this year.”
Here are the premium drivers, grouped into themes, using the observed patterns from the deals.
5.1 Demonstrated pricing power and superior economics
Buyers pay more when you can prove you are not a commodity middleman.
What it looks like in practice:
- Stable gross margin through supply shocks
- Clear pricing rules (not “whatever the salesperson promised”)
- Vendor terms and rebates that are defensible and repeatable
Why buyers care: distribution businesses with defensible spread and value-add (technical support, availability, kitting, light engineering) tend to separate from pure resellers in buyer narratives.
5.2 Integration-ready platform (cross-sell and adjacency expansion)
Premium outcomes often show up when the target clearly “slots into” the buyer’s machine - product adjacency, services complementarity, or route-to-market expansion.
Founder-friendly examples:
- You have an installer network that lets a buyer push new SKUs fast
- Your logistics and branch footprint reduces delivery times materially
- Your account base is the exact customer set the acquirer struggles to reach today
5.3 Category leadership and enterprise credibility
Buyers pay up when they believe you are a “default choice” in a niche or region.
Signals that matter:
- #1-#2 position in a geography (even if that geography is narrow)
- A reputation for quality and fast problem resolution
- Enterprise accounts that stick (because switching is painful)
5.4 Specialist technical services that reduce execution risk
Service platforms that reduce quality and delivery risk (engineering review, QA, commissioning support, interconnection expertise) can lift revenue multiples because they are sticky and defensible.
Practical examples:
- Paid design validation for installers (catch issues before installation)
- Commissioning and documentation services that speed PTO (permission to operate)
- QA programs tied to warranty handling and vendor relationships
5.5 Resilience through cycles (profitability consistency)
In the data, “premium inside distribution” tends to correlate with consistently higher EBITDA margins and lower volatility, not just scale.
What buyers want to see:
- A business that stays profitable even when demand slows
- Evidence you can pass through price changes, manage inventory, and protect cash
5.6 The basics that still move value
Even in solar, the classic drivers matter:
- Clean financials and normalised EBITDA (no surprises)
- Diversified customer base
- Strong leadership bench (not founder-only relationships)
- Predictable working capital needs
6. Discount Drivers (What Lowers Multiples)
Most valuation disappointment is not because “buyers are cheap.” It is because buyers see risk - and they protect themselves by lowering the multiple, demanding earnouts, or both.
Common discount drivers in solar solutions:
- Low visibility revenue: no backlog quality, no recurring service, no framework agreements
- Customer concentration: one or two installer partners are a huge share of sales with no contract protection
- Commodity exposure: you sell what everyone else sells, at similar terms, with no differentiated service layer
- Margin volatility: earnings swing with module pricing, freight, or inventory write-downs
- Weak working capital discipline: slow receivables, lumpy inventory, unclear obsolescence reserves
- Founder dependency: supplier terms, key customers, and problem-solving live in one person’s inbox
- Messy financial reporting: unclear SKU profitability, inconsistent recognition on project revenue, “adjustments” that are really just costs
The good news: many of these are fixable in 6-12 months if you treat them like a sale-readiness project.
7. Valuation Example: A Solar Energy Solutions Company
This is a worked example to show the logic, not a promise of price.
Step 1: The logic (plain English)
- Classify the business model correctly (distribution vs EPC vs manufacturer vs asset owner).
- Anchor on the most relevant public and private comp ranges.
- Pick a “core” multiple band that fits your category.
- Move up or down based on proven premium drivers (pricing power, margins, stickiness, integration value) and discount factors (concentration, volatility, weak reporting).
- Translate that into an enterprise value range.
Step 2: Apply it to a fictional company (USD 10m revenue)
Meet HelioBridge Solutions (fictional):
- Specialty distributor of solar + storage + EV charging hardware to installers
- USD 10.0m annual revenue (fictional)
- Two branches, growing regional installer base
- Mix of hardware sales + a small but growing commissioning/QA service line
Anchor ranges (distribution-relevant):
- Public distribution-like reference band: roughly ~0.7x-1.3x EV/Revenue for the most comparable cohorts.
- Private distributor-like cohort: roughly ~0.5x-0.9x EV/Revenue, with a stretch case to ~1.2x if economics and positioning are strong.
Now apply scenarios:
Step 3: What this means for you
Two solar distributors can both be “USD 10m revenue” businesses, but one sells for USD ~7m and another for USD ~15m because:
- buyers trust the margin durability,
- customers are diversified and sticky,
- and the business has credible differentiation beyond “we ship boxes.”
This example is illustrative only - not investment advice or a formal valuation.
8. Where Your Business Might Fit (Self-Assessment Framework)
Use this like a mirror, not a test. Score each factor 0-2:
- 0 = weak / not proven
- 1 = decent but inconsistent
- 2 = strong and well-documented
How to interpret:
- High band: you are closer to the top of your segment’s range (and you will get more “clean” offers, fewer earnouts).
- Middle band: fair market outcome if you run a competitive process.
- Low band: you may still sell, but you are more likely to see discounted multiples, heavy structure (earnouts/deferred), and tougher diligence.
9. Common Mistakes That Could Reduce Valuation
9.1 Rushing the sale
If you start a process before your numbers, story, and risk items are ready, buyers will control the narrative. In solar, that often means they frame you as “cyclical and commodity-exposed,” even if you are not.
9.2 Hiding problems
In diligence, issues surface anyway (customer concentration, warranty claims, margin swings). Hiding them destroys trust and usually converts value into structure (holdbacks, earnouts, escrows).
9.3 Weak financial records
Founders underestimate how much valuation is simply “confidence in the numbers.” If you cannot clearly explain margins by product line, revenue recognition (especially for EPC), warranty reserves, and working capital, buyers price in risk.
9.4 Not running a structured, competitive process
A competitive process (multiple credible buyers, clear timelines, consistent information flow) is one of the most reliable ways to improve outcomes because it creates price discovery and leverage.
Industry commentary and practitioner research often cite materially better outcomes - sometimes on the order of ~20-30% higher - when sellers run a structured process with professional support rather than negotiating with a single buyer.
9.5 Revealing your price too early
If you tell the market “we want USD 10m,” many buyers will anchor at USD 10m and nudge slightly above it. You kill the chance to learn what the market would have paid.
9.6 Two solar-specific mistakes that repeatedly hurt value
- Not documenting warranty and quality exposure (failure rates, reserves, supplier recovery). Buyers fear the long tail.
- Letting inventory become strategy: overbuying during shortages and getting caught with the wrong SKU mix when prices fall.
10. What Solar Energy Solutions Founders Can Do in 6-12 Months to Increase Valuation
Think of this as three parallel workstreams: improve the numbers, reduce perceived risk, and sharpen positioning.
10.1 Improve the numbers buyers pay for
- Build a monthly gross margin bridge (price, mix, rebates, freight, write-downs)
- Track profitability by SKU family and top 20 customers
- Make working capital predictable: tighter credit policy, faster collections, inventory ageing discipline
- If services exist, report them cleanly (separate gross margin, attach rate, repeat usage)
10.2 Increase revenue visibility without a massive pivot
- Convert top customers to framework agreements (terms + preferred supplier status)
- Add service attach where it is natural: commissioning support, QA checks, warranty handling, monitoring, maintenance plans
- Prove repeat behavior: cohort reporting (“customers who bought in Q1 also bought again in Q3”)
10.3 Reduce the buyer’s fear list
- Document warranty process and reserves (and recovery from suppliers where applicable)
- Reduce single points of failure: supplier diversification, second-source plans, key-person risk mitigation
- Build a management bench and “who owns what” map (so the business can run post-close)
10.4 Improve your sale-readiness narrative
- Define what you are: distributor, EPC, manufacturer, hybrid - and why that classification is attractive
- Make the “why us” simple: speed, reliability, technical support, niche dominance, or service layer
- Package proof: KPIs, customer references, supplier endorsements, safety record (for EPC)
11. How an AI-Native M&A Advisor Helps
A strong outcome is rarely about finding “a buyer.” It is about finding enough of the right buyers to create competitive tension, while running a process that keeps momentum and protects your leverage.
An AI-native M&A advisor expands buyer reach by screening hundreds of qualified acquirers based on deal history, synergy fit, and capacity. More relevant buyers usually means more competition, stronger offers, and a higher chance the deal closes because you have options if one buyer drops out.
AI can also compress timelines. With AI-driven buyer matching, faster preparation of marketing materials, and structured support through diligence, founders can often reach initial conversations and indications of interest much faster than with manual-only outreach - including the possibility of initial offers in under 6 weeks when the business is prepared.
Finally, you still want experienced human judgment. The best model is expert-led advisory enhanced by AI: senior deal leadership, credible positioning, and “Wall Street-grade” materials and negotiation - without traditional bulge bracket costs.
If you’d like to understand how our AI-native process can support your exit, book a demo with one of our expert M&A advisors.
Are you considering an exit?
Meet one of our M&A advisors and find out how our AI-native process can work for you.


