
What Are SaaS Multiples in 2026? The Correction Explained
A data-driven breakdown of where SaaS valuation multiples have stabilized in 2026, what caused the correction and which metrics now separate the outcomes.

If you built a SaaS company between 2019 and 2021, you probably carry a number in your head. Maybe it was 12x ARR. Maybe 18x. Maybe a competitor raised at 25x and you quietly recalibrated your expectations upward.
That number is wrong now. Not because your company got worse, but because the market that produced it was historically abnormal - and the correction that followed wasn't a dip. It was a structural repricing.
SaaS valuation multiples in 2026 have settled into a new baseline: median public SaaS trades around 4.8x-6.3x revenue, while private SaaS M&A deals close at a median of roughly 4.1x-4.7x. But the far more important number is the spread. Top-quartile SaaS companies still command 10x-15x, while bottom-quartile companies trade below 3.5x - and the factors that separate them have shifted meaningfully since the peak.
This article unpacks where SaaS multiples actually landed, what's driving the enormous gap between winners and losers, and what that means if you're a founder thinking about an exit.
In short: SaaS multiples compressed around 70% from 2021 peaks. Roughly 60% of that correction was driven by macro and capital market conditions (rising rates, tighter liquidity), while around 40% reflects real deterioration in forward growth expectations. The median has stabilized, but the spread between top and bottom quartile is now wider than it's been in years - driven primarily by net revenue retention, profitable growth composition, deal size, and increasingly, AI defensibility.
Where SaaS Multiples Actually Are in 2026
The first problem most founders face is that "SaaS multiples" isn't one number - it's a range that shifts dramatically depending on which dataset you're looking at, what denominator is being used, and whether you're looking at public trading multiples or actual deal values.
Here's a grounded snapshot using multiple independent sources from late 2025 through early 2026:
Public market benchmarks converge around mid-single digits. The SaaS Capital Index shows 4.8x on a run-rate revenue basis as of January 2026. The BVP Emerging Cloud Index, which skews toward higher-growth names, averages 6.3x with around 19% average growth. These are all down roughly 65-75% from the 2021 peaks, depending on which benchmark you use.
Private M&A deal multiples tell a similar story but with important nuance. Industry data from late 2025 shows a median of around 4.1x-4.7x EV/Revenue across SaaS transactions, with average multiples running higher at roughly 5.4x - a gap that reflects how a handful of premium deals pull the average above where most companies actually transact.
The correction wasn't subtle. Meritech's public SaaS universe shows a median EV/NTM revenue multiple falling from around 21x in late 2021 to roughly 6.3x by early 2024 - a 70% decline. But by early 2026, the story isn't about the decline anymore. It's about where within the new range your company lands, because that range is enormous.
How Much of the Correction Was the Market vs. Your Company
One of the most useful analyses we've come across breaks the SaaS multiple correction into two components, and the split is worth understanding because it changes how you should think about your own valuation.
Meritech publishes both raw EV/NTM revenue multiples and growth-adjusted multiples (what the market pays per unit of forward growth). Using their data from 2021 to early 2024, you can decompose the correction cleanly: approximately 60% of the multiple compression came from macro and capital market re-rating - essentially, the market deciding it would pay less per unit of growth regardless of fundamentals - while roughly 40% came from actual deterioration in forward growth expectations across the SaaS cohort.
That 60/40 split matters for founders because it answers a question many carry around without articulating it: Was my company's value destroyed, or did the market just change the rules?
The honest answer is both, but mostly the latter. The level shift - the whole index moving down together - was driven overwhelmingly by the end of zero interest rates, tighter liquidity, and a fundamental recalibration of what investors require in return for capital. Multiple sources tie the valuation turn explicitly to the moment the Federal Reserve began raising rates. In a zero-rate environment, paying 15-20x forward revenue for a growing SaaS company was mathematically defensible because the discount rate was negligible. When rates normalized, that math broke.
But the fundamental side wasn't trivial either. Median public software revenue growth dropped from above 20% in early 2022 to under 10% by early 2025 in tracked datasets. Net dollar retention - the single metric that most cleanly captures whether existing customers are spending more or less - declined from around 120% in 2021 to roughly 108% by late 2024, with private company medians sitting even lower at approximately 101%.
The practical takeaway: if you're a SaaS founder and your multiple expectations are still anchored to 2021, roughly 60% of the gap between your expectation and today's reality has nothing to do with your company. But if your growth has slowed or your retention has weakened, the other 40% does.
Why Two SaaS Companies at the Same ARR Get Wildly Different Valuations
The median multiple is a starting point, not an answer. In 2026, two SaaS companies at $8M ARR can receive very different offers - and the reasons are more specific than "one is better than the other."
Here are the factors that most reliably separate the 3.5x outcome from the 10x+ outcome, ranked roughly by their impact on observed deal pricing:
Deal size is one of the biggest "hidden variables"
Before you get to any operational metric, the size of the deal itself creates a structural multiple discount that's hard to overcome with fundamentals alone.
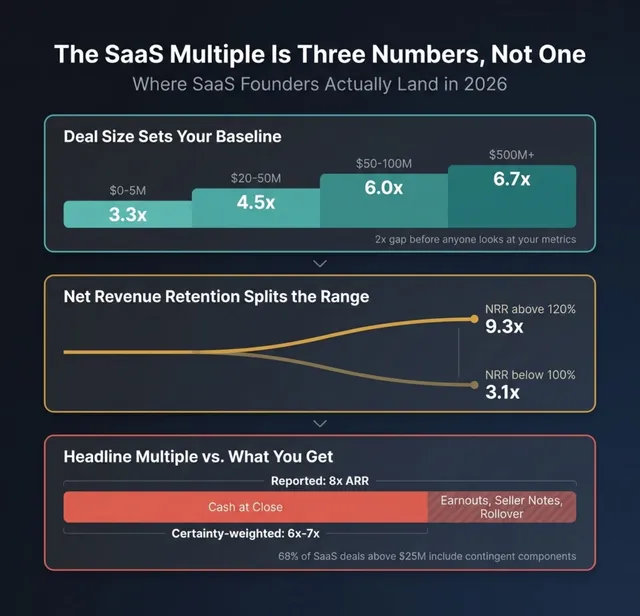
Industry transaction data shows a clear ladder: deals valued at $0-5M close at a median of around 3.3x revenue, $20-50M deals at roughly 4.5x, $50-100M at 6.0x, and $500M+ at 6.7x. That's a 2x multiple gap between the smallest and largest deal brackets that exists before anyone looks at your growth rate or retention.
The reasons are structural, not subjective. Fixed diligence costs become disproportionately large relative to enterprise value. Customer concentration and key-person risk are statistically higher. And financing is harder and more expensive at small enterprise values, which directly constrains what a leveraged buyer can pay.
This doesn't mean small SaaS companies can't achieve strong multiples, but it means the path to a premium valuation at small scale requires exceptional fundamentals in other areas - particularly retention and profitability.
Net revenue retention is a sharp valuation fork
Net revenue retention divides SaaS companies into two clear valuation tiers. It measures the rate at which existing customers expand, contract, or churn, measured in dollar terms.
The data here is striking. Public SaaS companies with NRR above 120% trade at a median of roughly 9.3x revenue. The index median sits around 5.7x. And companies with NRR below 100% - meaning they lose more revenue from existing customers than they gain - trade at a median of approximately 3.1x. That's a 3x multiple gap explained by a single metric.
In private markets, the pattern is the same but with even more pronounced consequences at the low end. Multiple industry sources indicate that NRR below 100% triggers discounted pricing, often pushing multiples below 3.5x regardless of other metrics like growth rate or market position.
What makes NRR so powerful as a valuation driver is what it signals to buyers. Strong NRR tells them the product is genuinely embedded in customer workflows, that expansion doesn't require unsustainable sales spend, and that the revenue base is resilient even in tighter budget environments. Weak NRR tells them the opposite - and in a market where buyers are underwriting to downside scenarios, that's often enough to cap the multiple regardless of what topline growth looks like.
The Rule of 40 still works - but how you get there now matters more than whether you hit it
The Rule of 40 - the idea that a SaaS company's revenue growth rate plus profit margin should exceed 40% - has been a valuation shorthand for years. In 2026, it's still correlated with higher multiples, but buyers have become far more sophisticated about what counts.
The correlation is real: public data shows companies below 20% on the Rule of 40 composite trading at around 3.1x, companies in the 20-40% range at roughly 5.2x, and companies above 60% at 14.1x or higher. One analysis estimates that a 10-point improvement in Rule of 40 corresponds to approximately 1.4x higher revenue multiple.
But here's what changed: the composition of that 40% now matters as much as hitting the number. Multiple independent datasets from early 2026 show that at the same Rule of 40 score, more profitable companies trade at meaningfully higher multiples than faster-growing but unprofitable ones. One dataset shows the gap at roughly 5.6x versus 3.9x for companies with similar composite scores but different profit-to-growth ratios.
This represents a genuine shift from 2020-2021, when growth was weighted 3x more heavily than profitability in explaining valuation. Growth still matters - Bessemer's "Rule of X" framework suggests 1% of growth has roughly 2.3x the valuation impact of 1% of free cash flow margin - but the market now treats profitability as a credibility filter. If you're burning heavily, buyers assume the growth may not be self-sustaining, and that assumption caps your multiple.
Bessemer's variant, which they call the "Rule of X," weights growth roughly 2-3x relative to profitability and shows a better statistical fit with observed valuations (R-squared of around 62% versus 50% for the traditional Rule of 40). The practical implication for founders: Rule of 40 is a useful health screen, but it's no longer a valuation shortcut. Getting to 40% with 35% growth and 5% margin is valued very differently than getting there with 20% growth and 20% margin - and in the current market, the latter often commands a premium.
Vertical focus can be a premium or a trap - it depends on defensibility
"Vertical SaaS commands a premium" was conventional wisdom for several years, and there's data to support it: public vertical SaaS companies have traded at meaningful premiums over horizontal peers in multiple recent quarters, and vertical platforms represented 54% of SaaS M&A volume in the third quarter of 2025, up from 43% a year earlier.
But the story has become more conditional. Some data shows vertical SaaS categories trading at lower multiples than horizontal infrastructure categories like DevOps or security. The explanation is a bifurcation that's accelerated in 2025-2026: vertical SaaS platforms that function as mission-critical systems of record - deeply embedded in customer workflows, integrated with industry-specific data, and carrying high switching costs - continue to command strong premiums. Industry sources suggest buyers pay 25-30% premiums for this profile, particularly when combined with embedded fintech revenue or AI-enabled automation.
But vertical platforms that are essentially "thin UI plus business rules" - where the value capture sits in a layer that AI-enabled tools could plausibly replace - are seeing multiple compression. This distinction isn't academic. It's showing up in how buyers evaluate vertical SaaS in diligence, and it means "we're vertical" is no longer sufficient as a valuation argument.
AI positioning is no longer a narrative bonus - it's an underwriting line item
When 72% of SaaS M&A deals in 2025 referenced AI in some form, "we have an AI strategy" stopped being differentiating. What matters now is whether a buyer's diligence confirms that AI strengthens or weakens the company's competitive position.
The valuation impact runs in both directions. Companies where AI improves margins, enhances retention (by making the product more valuable to existing customers), or creates defensible data advantages can command top-quartile multiples. Industry data suggests top-quartile AI and security platforms command 11x-15x in recent transactions.
But companies where AI threatens to commoditize the core workflow - where a foundation model could plausibly replace what the software does - face the opposite dynamic. This is particularly acute for horizontal SaaS in categories like basic analytics, content generation, or simple automation, where AI alternatives are emerging rapidly.
The underwriting question buyers now ask isn't "do you use AI?" but "does AI make your moat deeper or shallower?" That question has become as important as NRR or Rule of 40 in determining where within the multiple range a company lands.
What Buyers Actually Underwrite Now (and Why "The Multiple" Is Increasingly Misleading)
Perhaps the least understood shift in post-2022 SaaS M&A is that headline multiples have become less reliable as a measure of what sellers actually receive. This is because deal structures changed fundamentally - and the changes aren't cosmetic.
Earnouts have become standard in SaaS, not exceptional. Industry data shows earnouts present in roughly 68% of SaaS transactions above $25M, typically representing 15-30% of total deal value over 12-24 months. In broader private M&A, earnouts appear in roughly 26-33% of deals - meaning SaaS deals are nearly twice as likely to include contingent consideration.
This changes the math in a way that's easy to overlook. A deal reported at "8x ARR" where 25% of the value is contingent on hitting revenue or retention milestones over 18 months has a certainty-weighted multiple closer to 6x-7x at close. The remainder is probabilistic - and the milestones are increasingly tied to the very metrics (NRR, growth, profitability) that this article has identified as the primary valuation drivers.
Seller financing has returned as a meaningful deal component, particularly in deals under $100M, where seller notes represent 10-20% of transaction value. Rollover equity is similarly widespread - one mid-market dataset shows 63.6% of deals using rollover equity, averaging 14.5% of purchase price.
The structural implication is that founders should think about valuation in two layers: the headline multiple that gets discussed during negotiations, and the certainty-weighted multiple that represents what's actually received at close in cash or liquid consideration. The gap between those two numbers has widened considerably since 2022, and understanding it is critical for making informed decisions about whether to proceed with a process.
One more structural nuance worth noting: revenue-based earnouts now dominate, representing roughly 62% of earnout structures versus 22% tied to earnings or EBITDA. This is actually a favorable shift for sellers, because revenue is harder for a buyer to manipulate through cost allocation after close. But it also means sellers are implicitly accepting conditionality in exchange for a higher headline number - a trade that only makes sense if you understand the terms clearly.
A Practical SaaS Valuation Bridge for 2026
Rather than offering a single "SaaS companies are worth X" answer, here's a practical framework that reflects how informed buyers actually triangulate valuation in the current market. This isn't theoretical - it's consistent with how we see transactions priced and how the data sources cited throughout this article stack up against each other.
Step 1: Start with the right baseline for your deal size.
Use the deal-size ladder as your anchor, not a headline public SaaS index:
- $0-5M deal value: Median around 3.3x revenue
- $5-20M deal value: Median around 3.5x-4.0x revenue
- $20-50M deal value: Median around 4.5x revenue
- $50-100M deal value: Median around 6.0x revenue
- $100M+ deal value: Median around 6.5x+ revenue
Step 2: Adjust up or down for net revenue retention.
NRR is the single biggest mover within any size bracket:
- NRR above 120%: Expect to trade in the top quartile for your size bracket, potentially 1.5x-2x the median
- NRR 100-110%: Roughly in line with the median
- NRR below 100%: Expect punitive pricing, often below 3.5x regardless of other metrics
Step 3: Apply the Rule of 40 as a credibility filter, not a formula.
Companies above 40% on the composite trade at roughly double the multiple of companies below 25%. But weight profitability appropriately - at the same composite score, a more profitable company currently commands a premium over a faster-growing but unprofitable one.
Step 4: Assess category positioning and AI defensibility.
Is the product a system of record with deep workflow integration and switching costs, or a feature layer that AI could plausibly replace? Mission-critical vertical platforms and AI-enabling infrastructure categories command the highest premiums. Commoditized horizontal tools face compression.
Step 5: Convert the headline multiple to a certainty-weighted multiple.
If the deal includes earnouts, seller financing, or rollover equity, calculate what you receive at close in cash or liquid consideration. In 2026, the gap between headline and certainty-weighted multiples is often 15-30% of total deal value.
The Counterargument: "Multiples Don't Matter - Only IRR Matters"
If you spend time around private equity buyers, you'll hear a version of this argument: multiples are just an output of their return model, and what really determines the price is the IRR they can underwrite based on entry leverage, margin improvement, and exit assumptions.
There's truth in this. PE-backed buyers now account for an estimated 51-58% of SaaS M&A volume, and their underwriting is fundamentally cash-flow and return-driven. When rates rose, their purchase price capacity mechanically declined because debt service coverage constraints tightened - not because they changed their views on multiples per se, but because the math forced lower entry prices to hit the same return targets.
But the practical implication for founders is the same: the factors that drive multiples (retention, profitable growth, category positioning) are also the factors that drive a PE buyer's forward model. A company with strong NRR and healthy margins gives the buyer confidence in cash generation and deleveraging, which supports a higher entry price at the same IRR target. A company with weak retention and thin margins forces conservative assumptions, which compresses the price regardless of what "the market multiple" is.
So whether you think about it as "multiples" or "buyer IRR capacity," the same fundamentals determine the outcome - and the same levers are within your control.
Key Takeaways
- SaaS valuation multiples in 2026 have stabilized at around 4.8x-6.3x for public benchmarks and 4.1x-4.7x for private M&A deal medians - a roughly 70% decline from 2021 peaks that appears durable.
- Approximately 60% of the SaaS multiple correction was macro-driven (rising rates, tighter liquidity), while around 40% reflected real deterioration in forward growth and retention fundamentals.
- Net revenue retention is a valuation fork in SaaS: companies above 120% NRR trade at roughly 3x the multiple of those below 100%, and NRR below 100% triggers punitive pricing in private M&A regardless of other metrics.
- Rule of 40 is still predictive but composition now matters: at the same composite score, more profitable SaaS companies trade at higher multiples than faster-growing but unprofitable ones - a meaningful shift from 2020-2021.
- Deal size creates a structural multiple discount of roughly 2x between the smallest ($0-5M) and largest ($500M+) SaaS deals, before any operational metrics are considered.
- Headline multiples are increasingly misleading because earnouts (present in around 68% of SaaS deals above $25M), seller notes, and rollover equity mean the certainty-weighted multiple at close is often 15-30% lower than the reported number.
- AI positioning has shifted from narrative bonus to underwriting line item: with 72% of 2025 SaaS deals referencing AI, the differentiator is whether AI strengthens or weakens the company's moat.
- Vertical SaaS premiums are now conditional on defensibility: mission-critical systems of record still command premiums, but "thin" vertical tools face compression from AI-enabled alternatives.
Frequently Asked Questions
What are typical SaaS valuation multiples in 2026? Median public SaaS trades at roughly 4.8x-6.3x revenue depending on the benchmark and denominator used, while private SaaS M&A deals close at a median of approximately 4.1x-4.7x EV/Revenue. Top-quartile companies with strong retention and profitable growth still achieve 10x-15x.
Is the Rule of 40 still relevant for SaaS valuations? Yes, but the composition matters more than the score itself. Companies above 40% trade at roughly double the multiple of those below 25%, but in the current market, profitability is weighted more heavily than growth at the same composite score - a shift from the growth-at-all-costs era.
How much does NRR matter for SaaS company valuation in 2026? Net revenue retention (NRR) has emerged as one of the sharpest predictors of valuation tier. Companies above 120% NRR trade at roughly 3x the multiple of those below 100%, and sub-100% NRR increasingly triggers automatic valuation discounts in buyer underwriting models.
How do private SaaS multiples compare to public market multiples? The gap is smaller than many assume in 2026. Public SaaS benchmarks sit at roughly 4.8x-5.4x, while private deal medians are around 4.5x-4.7x. The bigger driver of multiple differences is deal size and quality mix rather than public-versus-private status.
Why do similar SaaS companies get very different valuations? The spread is driven primarily by deal size, net revenue retention, Rule of 40 composition (profit vs. growth weighting), vertical positioning and defensibility, and AI exposure. Two companies at the same ARR can differ by 3-4x in valuation based on these factors.
How have SaaS deal structures changed since 2022? Earnouts are now present in roughly 68% of SaaS deals above $25M (versus 26-33% in broader M&A), seller financing has returned at 10-20% of deal value in sub-$100M transactions, and rollover equity appears in over 60% of PE-backed deals. The result is that the certainty-weighted multiple at close is often materially lower than the headline number.
If you're a SaaS founder exploring what your company might be worth in this market - or trying to figure out which of these levers you can realistically move before a process - we're happy to walk through it. You can book a conversation with one of our M&A advisors to discuss your specific situation.
Are you considering an exit?
Meet one of our M&A advisors and find out how our AI-native process can work for you.


